New Blog: Bringing (Gen) AI from Laptop to Production with MLRun

LLM as a Judge: Practical Example with Open-Source MLRun

LLM as a Judge: Practical Example with Open-Source MLRun

LLMs can be used for evaluating other models, which is a method known as “LLM as a Judge”. This approach leverages the unique capabilities of LLMs to assess and monitor the performance and accuracy of models. In this blog, we will show a practical example of operationalizing and de-risking an LLM as a Judge in with the open-source MLRun platform.

Brief Reminder: What is LLM as a Judge?

“LLM as a judge” refers to using LLMs to evaluate the performance and output of AI models. The LLM can analyze the results based on predefined metrics such as accuracy, relevance, or efficiency. It may also be used to compare the quality of generated content, analyze how models handle specific tasks, or provide insights into strengths and weaknesses.

Why Use LLM as a Judge?

LLM as a Judge is an evaluation approach that helps bring applications to production and derives value from them much faster. This is because LLM as a Judge allows for:

  • Availability – LLMs operate 24/7, providing instant feedback in time-sensitive contexts.
  • Adaptability – Prompt engineering allows easily adjusting evaluation criteria.

What to Look Out for When Using LLM as a Judge

When using a Large Language Model (LLM) as a judge for evaluating other models, several significant risks must be carefully considered to avoid faulty conclusions:

  • Bias propagation – LLMs are trained on vast datasets that may contain inherent biases related to race, gender, or culture. If these biases are not addressed, they can directly affect the evaluation process, leading to unjust or skewed assessments of the models being tested.
  • Over-reliance on language and syntax – The LLM may favor models that produce more fluent or persuasive language over those that generate more accurate or innovative content. This creates the risk of misleading results.
  • Hallucinations – When the LLM generates plausible-sounding but incorrect or irrelevant information. This becomes problematic during model evaluation as the LLM might misinterpret the data or generate false positives/negatives in its assessment.
  • Ground truth or benchmarking – The LLM might inaccurately assess models in specialized fields like law, medicine, or science. Without access to verifiable facts or empirical data, the LLM may rely too heavily on its own internal reasoning processes, which can be flawed, resulting in unreliable judgments.
  • Model drift -Updates to the LLM or changes in its underlying data can shift its evaluation standards over time, leading to inconsistency in assessments.
  • Model Updates – When using third-party LLMs, updates to the model might modify performance, even breaking it.

Addressing these risks requires thorough validation, human oversight, careful design of evaluation criteria and evaluating the model Judge for the task. This will ensure reliable and fair outcomes when using an LLM as an evaluator.

How to Operationalize Your LLM as a Judge in MLRun

In this example, we’ll show how to implement LLM as a Judge as part of your monitoring system with MLRun. You can view the full steps with code examples here.

Here’s how it works:

  1. Create a LLM as a Judge monitoring application (or use the one shown in the demo).
  2. Set it in the MLRun project as a monitor application.
  3. Deploy it and enjoy.

To prompt engineer the judge you can follow the best practices here:

  1. Create an evaluation set the judge can be scored on.
  2. Build a prompt with multiple explanations about the metric, scores and add multiple examples the LLM can learn from.
  3. Try it out with a few examples.
  4. Run the evaluation set and check the performance.
  5. Do it periodically to ensure the judge is on track.

Conclusion

LLM as a Judge is a useful method that can scale model evaluation. With MLRun, you can quickly fine-tune and deploy the LLM that will be used as a Judge, so you can operationalize and de-risk your gen AI applications. Follow this demo to see how.

Just getting started with gen AI? Start with MLRun now.

Recent Blog Posts
MLRun v1.8 Release: with Smarter Model Monitoring, Alerts and Tracking
MLRun v1.8 adds features to make LLM and ML evaluation and monitoring more accessible, practical and...
Gilad Shaham
September 26, 2024
Fine-Tuning in MLRun: How to Get Started
How to fine tune an existing LLM quickly and easily with MLRun, with two practical hands-on examples...
Nick Schenone
September 26, 2024
Bringing (Gen) AI from Laptop to Production with MLRun
Find out how MLRun replaces manual deployment processes, allowing you to get from your notebook to p...
Gilad Shapira
September 26, 2024

How to Operationalize Your Own Customized Application for Monitoring LLMs with MLRun

Operationalize Your Own Customized Application for Monitoring LLMs

LLM monitoring helps optimize for accuracy and efficiency, detect bias and ensure security and privacy. But common metrics like BLEU and ROUGE aren’t always accurate enough for LLM monitoring. By developing your own monitoring application, you can customize and tailor the metrics you need, monitor in real-time, integrate with other systems, and more. In this blog post, we explain how to do this with MLRun.

Why Monitor LLMs and Gen AI Applications?

Monitoring generative AI applications and LLMs is an essential step in the AI pipeline. By monitoring, data professionals ensure models are accurate and bring business value. It also helps remove the risks associated with gen AI.

Overall, LLM monitoring can help:

  • Manage resources and reduce operational costs.
  • Optimize for efficiency and accuracy, ensuring model reliability at a given task and checking if it needs to go into another phase of development.
  • Detect errors, biases, or inaccuracies in outputs, ensuring they meet quality standards.
  • Identify and mitigate ethical issues like bias and toxicity, before they become public concerns.
  • Ensure data privacy and security, to prevent data leakage, violation of privacy regulations, and more
  • Meet compliance regulations.
  • Understand how users interact with the model.
  • Build trust among stakeholders.

Key LLM Metrics to Track

There are many trackable LLM metrics, which can help meet the objectives detailed above. These include first-level metrics, model-related metrics, data metrics and more.

If the pipeline is: X -> Model -> Y

  • Data metrics check X.
  • Accuracy metrics check Y and sometimes Y | X (Y given X).
  • Performance check the arrows.

Given this, the common metrics include:

  • Performance Optimization – Latency, throughout, resource utilization (CPU/GPU memory usage), data drift, sensibleness and specificity.
  • LLM Evaluation (Accuracy) – Perplexity, BLEU (Bilingual Evaluation Understudy), ROUGE (Recall-Oriented Understudy for Gisting Evaluation), METEOR (Metric for Evaluation of Translation with Explicit Ordering), F1 score and accuracy.
  • Data Metrics – Data drift

Additional metrics that can be monitored include:

  • User Engagement – Session length, token efficiency
  • Ethical Compliance – Adherence to guidelines, like privacy, non-discrimination, transparency and fairness.

In addition to these, data engineers and scientists can also come up with their own metrics, based on use cases and requirements. This is valuable for monitoring LLMs, since these popular metrics don’t always cover unique LLM monitoring needs.

For example:

  • Logic monitoring metrics, which evaluate the logical processes and decision-making pathways of a system. They include input classification, response consistency, error detection, decision pathway analysis, and performance measurements.
  • Domain-specific metrics or evaluation methods, including industry-specific terminologies, contextual relevance, or specialized linguistic nuances.
  • Bias detection algorithms that operate based on your organization’s ethical standards and regulatory requirements.

Benefits of Operationalizing Your Own Monitoring Application

By developing your own monitoring application, you can monitor LLMs based on the metrics you need, to ensure your LLM is fully-optimized to your use case. This will ensure it brings business value and help avoid LLM risks that have technological and business implications.

By developing and deploying your own monitoring application you can:

  • Tailor evaluation criteria to align closely with your specific use case or domain, maximizing business value.
  • Incorporate real-time monitoring, alerting you about anomalies or performance issues as they occur.
  • Integrate your monitoring application seamlessly with other internal systems or workflows
  • Future-proof to adapt as new models and technologies emerge, keeping your application relevant and up-to-date.
  • Generate customized reports tailored to your organization’s specific needs, providing actionable insights and data-driven decision-making.

How to Easily Develop a Monitoring Application for Your LLM with MLRun

Open-source MLRun provides a radically simplified solution, allowing anyone to develop and deploy their own monitoring application in a few simple lines of code. Inherit the `MonitoringApplication` class, implement one method and that’s it!

You can see the full tutorial with code snippets and examples in the MLRun documentation.

Get started with MLRun now.

Recent Blog Posts
MLRun v1.8 Release: with Smarter Model Monitoring, Alerts and Tracking
MLRun v1.8 adds features to make LLM and ML evaluation and monitoring more accessible, practical and...
Gilad Shaham
July 24, 2024
Fine-Tuning in MLRun: How to Get Started
How to fine tune an existing LLM quickly and easily with MLRun, with two practical hands-on examples...
Nick Schenone
July 24, 2024
Bringing (Gen) AI from Laptop to Production with MLRun
Find out how MLRun replaces manual deployment processes, allowing you to get from your notebook to p...
Gilad Shapira
July 24, 2024

Open Source MLOps and LLMOps Orchestration with MLRun: Quick Start Tutorial

Open Source MLOps and LLMOps Orchestration with MLRun: Quick Start Tutorial

MLRun is an open-source MLOps and gen AI orchestration framework designed to manage and automate the machine learning lifecycle. This includes everything from data ingestion and preprocessing to model training, deployment and monitoring, as well as de-risking. MLRun provides a unified framework for data scientists and developers to transform their ML code into scalable, production-ready applications.

In this blog post, we’ll show you how to get started with MLRun: creating a dataset, training the model, serving and deploying. You can also follow along by watching the video this blog post is based on or through the docs.

When starting your first MLRun project, don’t forget to star us on GitHub.

Now let’s get started.

Creating Your First MLRun Project

An MLRun project helps organize and manage the various components and stages of an ML or gen AI workflow in an automated and streamlined manner. It integrates components like datasets, code, models and configurations into a single container. By doing so, it supports collaboration, ensures version control, enhances reproducibility and allows for logging and monitoring.

  1. Install and import MLRun. More details on how to do it.
  2. Create a project with project = mlrun.get_or_create_project(name=”quick-tutorial”, user_project=True).

This will create the project object, which will be used to add and execute functions.

  1. Now for the dataset. This only requires a simple script with one Python function that grabs a dataset from scikit-learn and returns it as a pandas dataframe.

%%writefile data-prep.py


import pandas as pd

from sklearn.datasets import load_breast_cancer


def breast_cancer_generator():

    “””

    A function which generates the breast cancer dataset

    “””

    breast_cancer = load_breast_cancer()

    breast_cancer_dataset = pd.DataFrame(

        data=breast_cancer.data, columns=breast_cancer.feature_names

    )

    breast_cancer_labels = pd.DataFrame(data=breast_cancer.target, columns=[“label”])

    breast_cancer_dataset = pd.concat(

        [breast_cancer_dataset, breast_cancer_labels], axis=1

    )


    return breast_cancer_dataset, “label”

This is regular Python. MLRun will automatically log the returning data set and a label column name. 4. Create an MLRun function using project.set_function, together with the name of the Python file and parameters specifying requirements. These could include running the function as a job with a certain Docker image.

data_gen_fn = project.set_function(

    “data-prep.py”,

    name=”data-prep”,

    kind=”job”,

    image=”mlrun/mlrun”,

    handler=”breast_cancer_generator”,

)

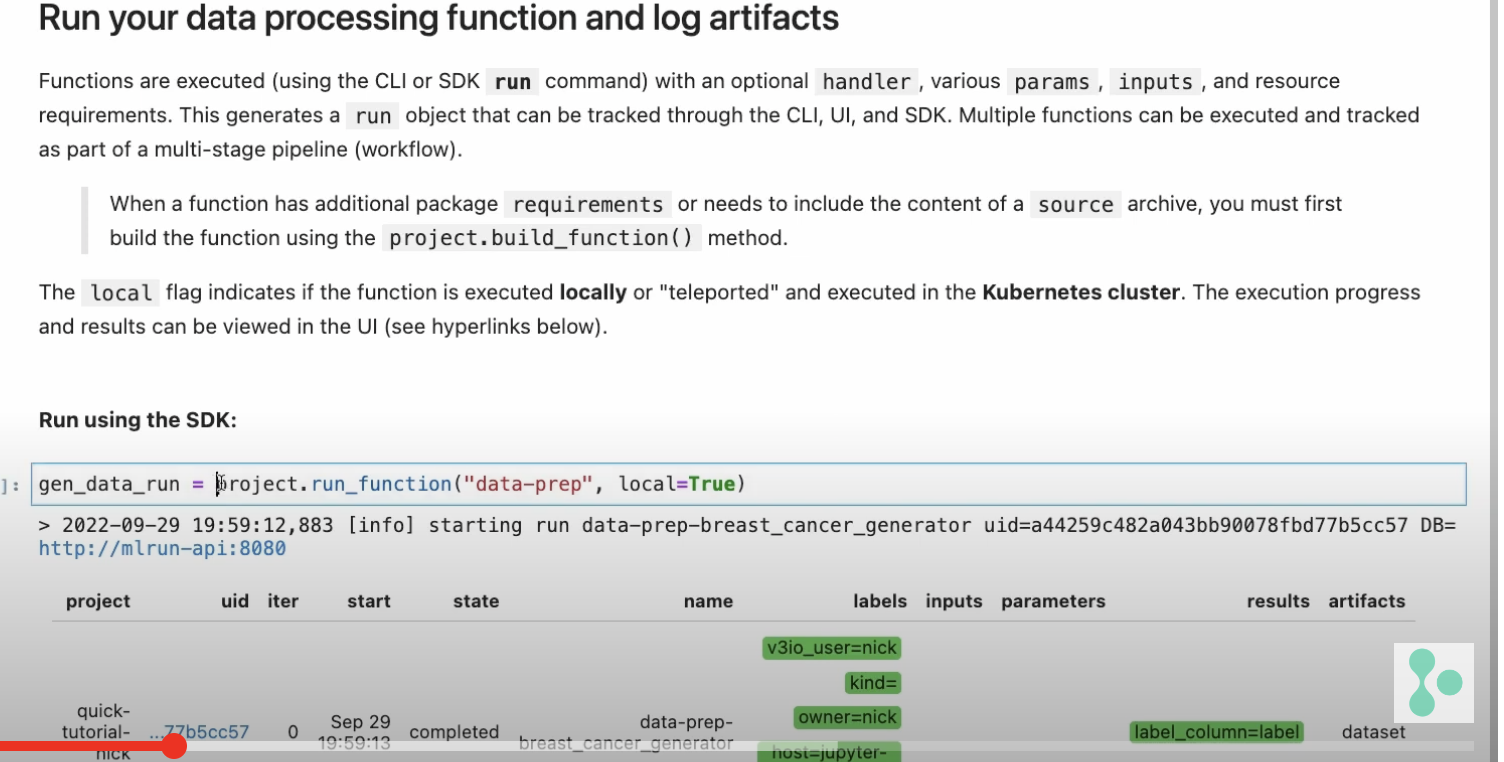
project.save()  # save the project with the latest config


  1. Save the project.
  2. Run the function with project.run_function together with the required parameters. For example, for running in a local environment, use (local=True), otherwise it runs at scale in Kubernetes. Notice the `returns` parameter where we specify what MLRun should log from the function’s returning objects.

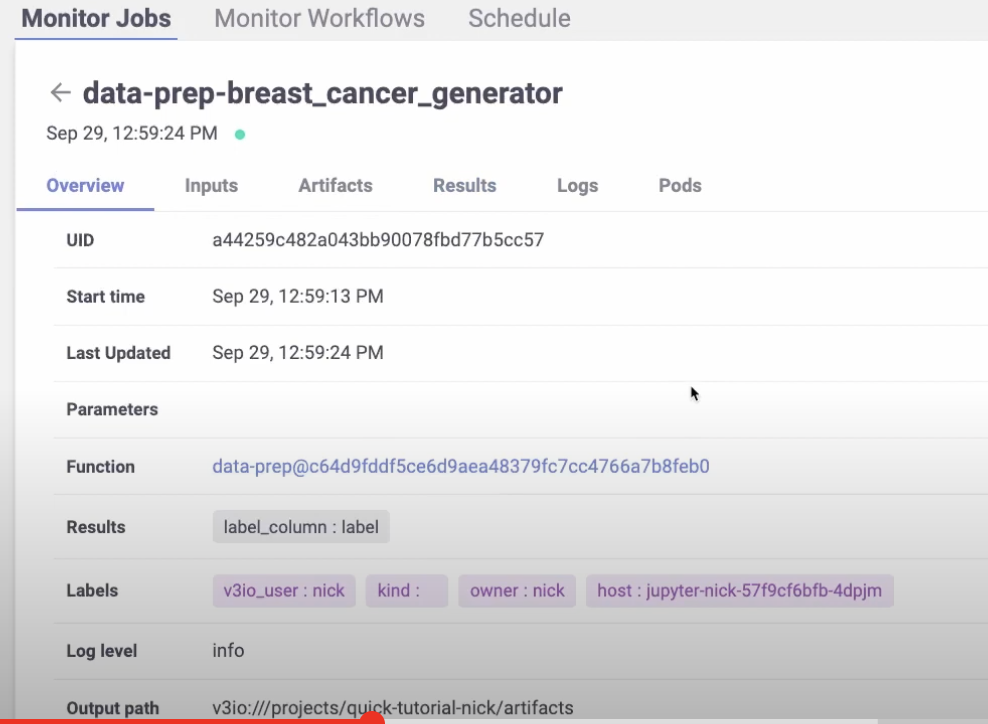
gen_data_run = project.run_function(

    “data-prep”, 

    local=True,

    returns=[“dataset”, “label_column”],

)

  1. Open the MLRun UI.
  2. View artifacts like the logged data sets, the label column, metadata and more.

Training the Model

Now let’s see how to train a model using the dataset that we just created. Instead of creating a brand new MLRun function, we can import one from the MLRun function hub.

  1. Go to the function hub.

Here’s what it looks like:


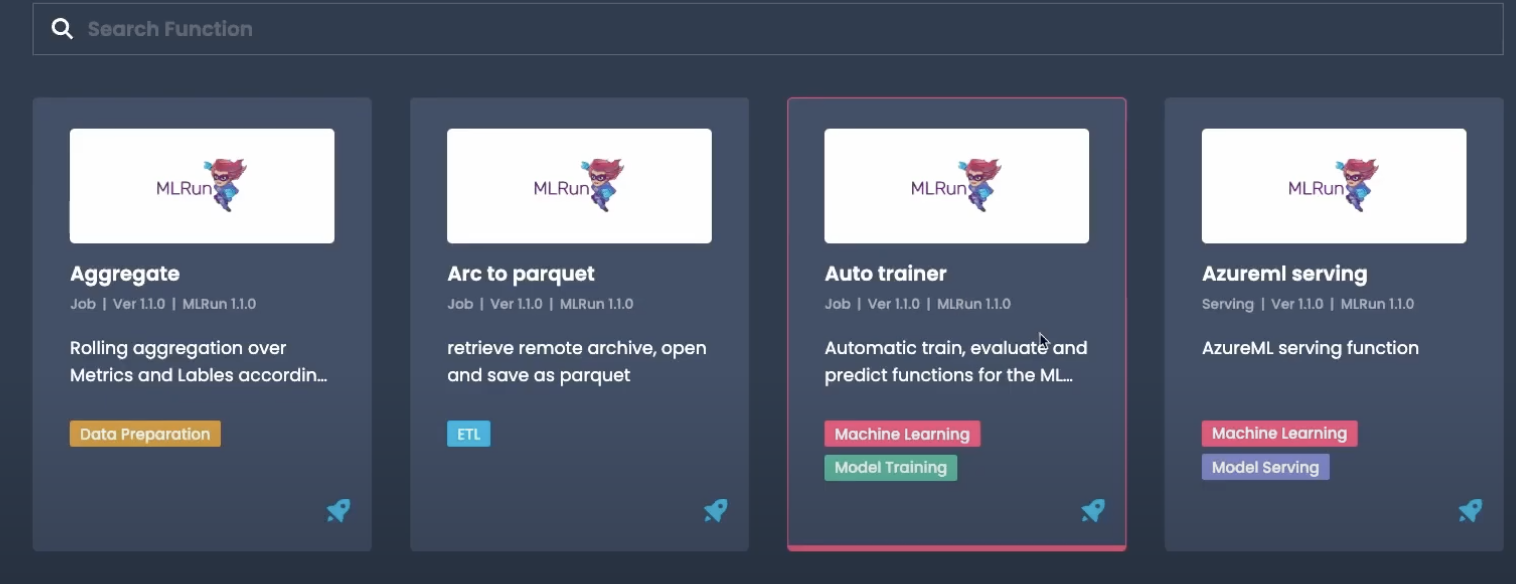
You will find a number of useful and powerful functions out-of-the-box. We’ll use the Auto trainer function.

  1. Import it by pointing to the marketplace and specifying the function name:

# Import the function

trainer = mlrun.import_function(“hub://auto_trainer”)

In this case, one of the parameters is the data set from our previous run.

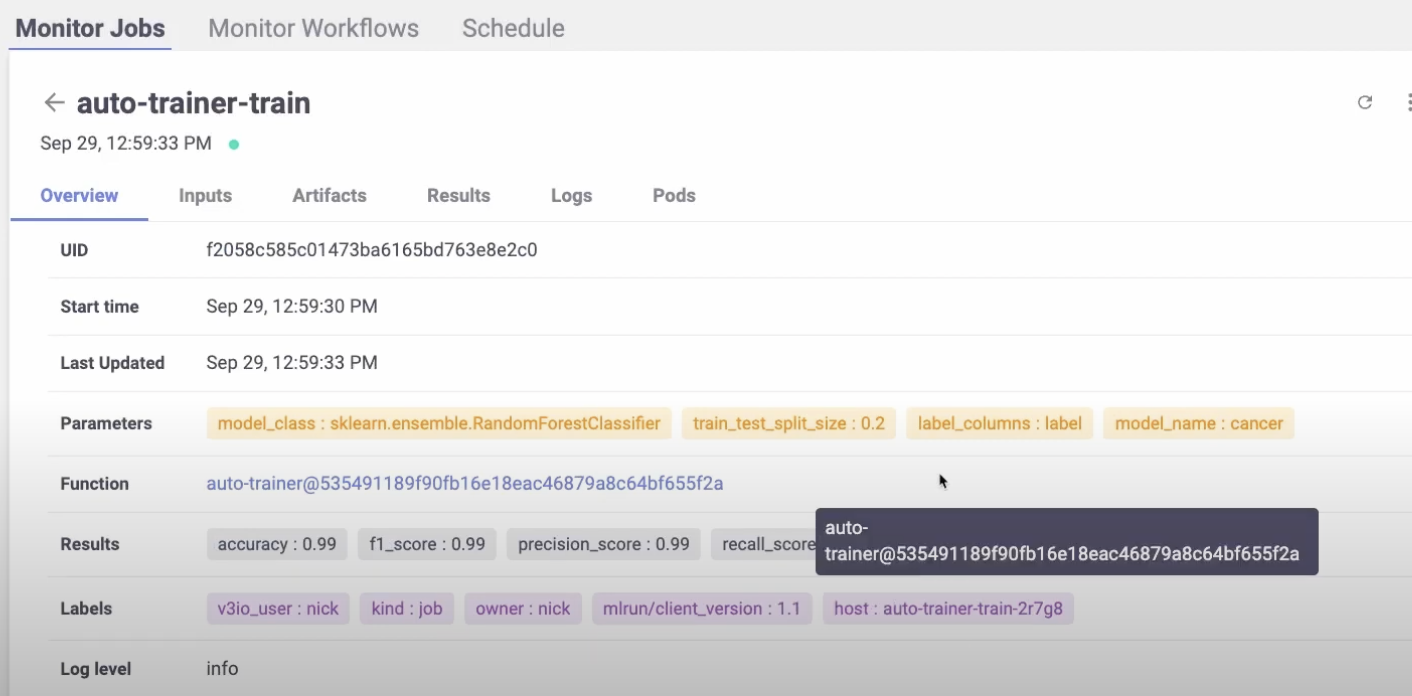
trainer_run = project.run_function(

    trainer,

    inputs={“dataset”: data_prep_run.outputs[“dataset”]},

    params={

        “model_class”: “sklearn.ensemble.RandomForestClassifier”,

        “train_test_split_size”: 0.2,

        “label_columns”: data_prep_run.results[“label_column”],

        “model_name”: “breast_cancer_classifier”,

    },

    handler=”train”,

)


The default is local=false, which means it will run behind the scenes on Kubernetes.

You will be able to see the pod and the print out statements.

  1. Open the MLRun UI, which will display more details and artifacts. For example, the parameters passed in the evaluation metrics, the model itself and more.

Serving the Model

Now we can serve the trained model.

  1. Type mlrun.new_function and select the kind as serving.

serving_fn = mlrun.new_function(

    “breast_cancer_classsifier_servingserving”,

    image=”mlrun/mlrun”,

    kind=”serving”,

    requirements=[“scikit-learn~=1.3.0”],

)


  1. Add your model to the serving function using serving_fun.add_model and the path to the model.
  • The path to the model is the output of the training job.
  • The class name specifies the model’s serving class where the API is.. There are built-in classes in MLRun, like the SciKit-Learn model server, in this example.

serving_fn.add_model(

    “breast_cancer_classifier_endpoint”,

    class_name=”mlrun.frameworks.SKLearnModelServer”,

    model_path=trainer_run.outputs[“model”],,

)


In this example, we are using sklearn. But you can choose your preferred framework from this list:

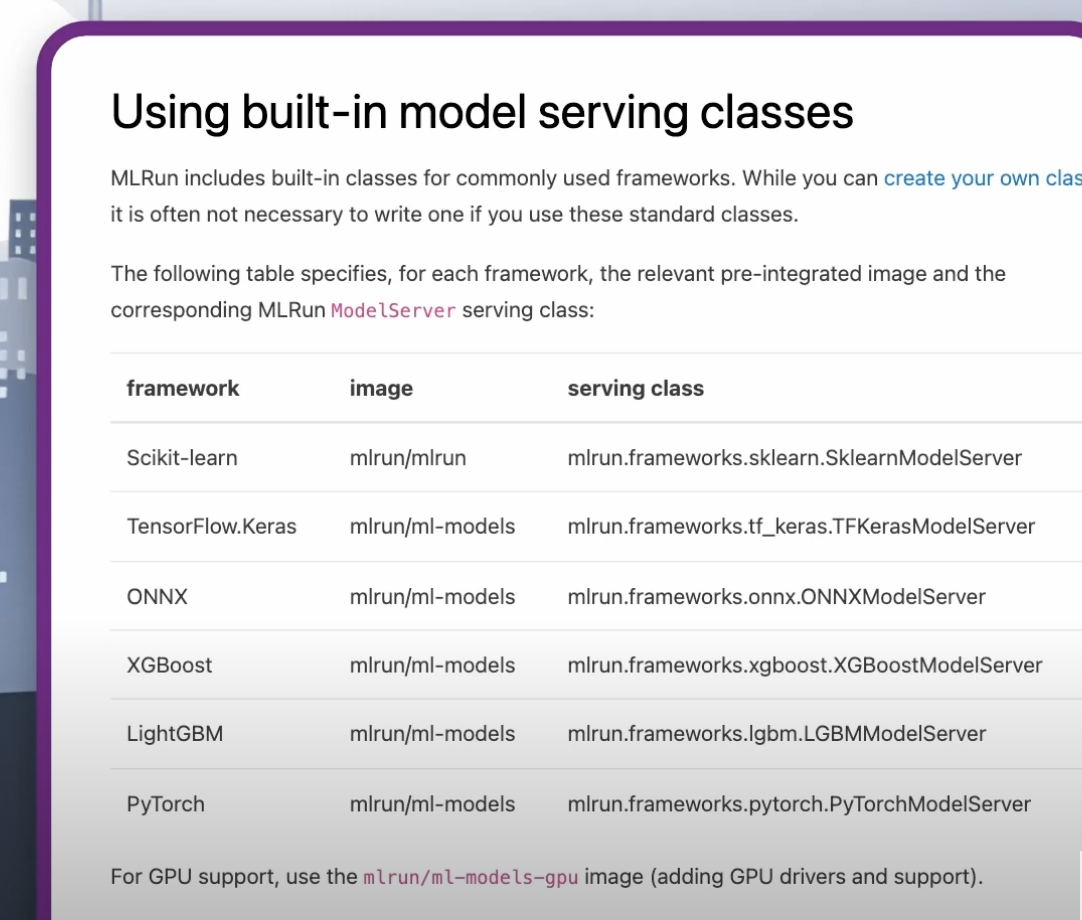
Or customize your own. You can read more about this in the docs.

The example below shows a simple, singular model. There are also more advanced models that include steps for data enrichment, pre-processing, post-processing, data transformations, aggregations and more.

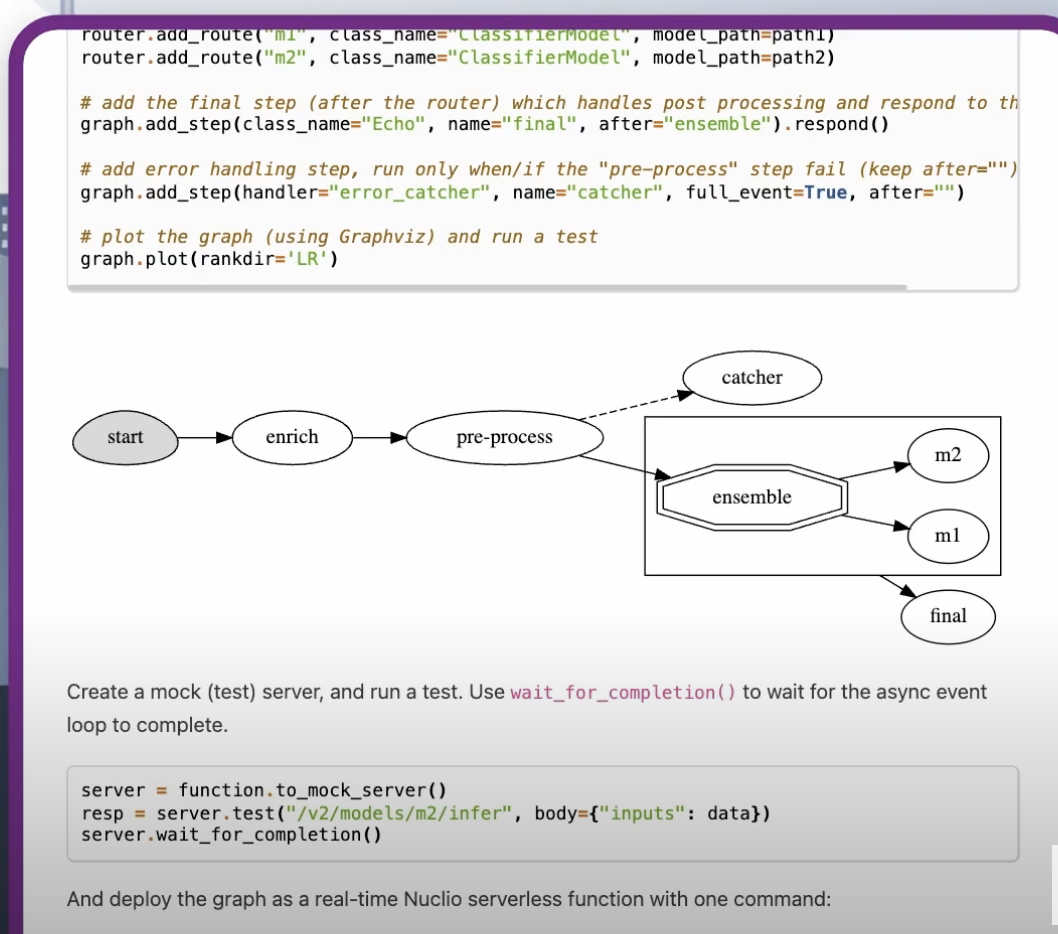
Read more about real-time serving here.

  1. Test the serving function using a mock server that simulates the model deployment. This allows making sure everything is behaving as expected without having to deploy.

# Create a mock (simulator of the real-time function)

server = serving_fn.to_mock_server()

Use the mock server `test` method (server.test) to test the model server.

The last part of the code is the model server, which you can send data inputs to and acts exactly like a model server.

Deploying the Model

Finally, it’s time to deploy to production with a single line of code.

  1. Use the `deploy` method:

serving_fn.deploy()

This will take the code, all the parameters, the pre- and post-processing, etc., package them up in a container deployed on Kubernetes and expose them to an endpoint. The endpoint contains your transformation, pre- and post-processing, business logic, etc. This is all deployed at once, while supporting rolling upgrades, scale, etc.

  1. Now, send data and see if you get a response as expected. Use the serving function `invoke` method (serving_fn.invoke) to send data from the notebook.

That’s it! You now know how to use MLRun to manage and deploy ML models. As you can see, MLRun is more than just training and deploying models to an endpoint. It is an open source machine learning platform that helps build a production-ready application that includes everything from data transformations to your business logic to the model deployments to a lot more.

Start using MLRun today.

Get more tutorials here.

Recent Blog Posts
MLRun v1.8 Release: with Smarter Model Monitoring, Alerts and Tracking
MLRun v1.8 adds features to make LLM and ML evaluation and monitoring more accessible, practical and...
Gilad Shaham
June 16, 2024
Fine-Tuning in MLRun: How to Get Started
How to fine tune an existing LLM quickly and easily with MLRun, with two practical hands-on examples...
Nick Schenone
June 16, 2024
Bringing (Gen) AI from Laptop to Production with MLRun
Find out how MLRun replaces manual deployment processes, allowing you to get from your notebook to p...
Gilad Shapira
June 16, 2024

Tutorial: Build a Smart Call Center Analysis Gen AI App with MLRun, Gradio and SQLAlchemy

Tutorial: Build a Smart Call Center Analysis Gen AI App with MLRun, Gradio and SQLAlchemy

Developing a gen AI app requires multiple engineering resources, but with MLRun the process can be simplified and automated. In this blog post, we show a tutorial of building an application for a smart call center application. This includes a pipeline for generating data for calls and another pipeline for call analysis. For those of you interested in the business aspect, we added information in the beginning about how AI is impacting industries.

You can follow the tutorial along with the respective Notebook and clone the Git. Don’t forget to star us on Github when you do! You can also watch the tutorial video.

How AI is Impacting the Economy

AI is changing our economy and ways of work. According to McKinsey, AI’s most substantial impact is in three main areas:

  • Productivity – Improving how businesses are run, from customer interactions to coding to content creation.
  • Product Transformation – Changing how products meet customer needs. This includes conversational interfaces and co-pilots, as well as hyper-personalization, i.e customer-specific content at a granular level.

Redistributing profit pools – AIaaS (AI-as-a-Service) is added to the value chain, resulting in new solutions and entire value chains being replaced.

AI Pitfalls to Avoid

When building a gen AI app and operationalizing LLMs, it’s important to perform the following actions:

  1. Define a value roadmapWithout a clear value roadmap, projects can easily drift from their intended goals. This roadmap aligns the AI initiative with business objectives, ensuring that the development efforts lead to tangible benefits.
  2. Avoid technological and operational debtAvoiding this debt ensures the long-term sustainability and maintainability of the AI system.
  3. Take into consideration the human experienceIgnoring the human experience can lead to an AI solution that users find difficult or unpleasant to use, impeding adoption and productivity.
  4. Use a scalable and resilient gen AI architecture to ensure you reach production – Otherwise, the architecture might fail under increased loads or during unexpected disruptions.
  5. Implement processes to ensure AI maturity and governanceWithout proper processes, the AI system can become unreliable, biased, or non-compliant with regulations. Governance ensures that the AI operates within acceptable ethical and legal boundaries.
  6. Define quantifiable KPIsClear KPIs create accountability and focus, ensuring that the project stays on track.

Now let’s dive into the hands-on tutorial.

Tutorial: Building a Gen AI Application for Call Center Analysis

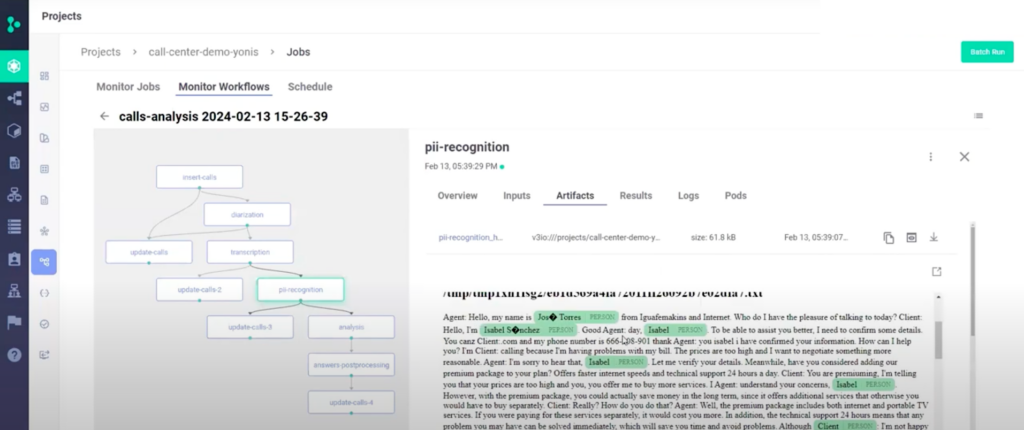
The following tutorial shows how to build an LLM call center analysis application. We’ll show how you can use gen AI to analyze customer and agent calls so your audio files can be used to extract insights.

This will be done with MLRun in a single workflow. MLRun will:

  • Automate the workflows
  • Auto-scale resources
  • Automatically distribute inference jobs to workers
  • Automatically log and parse the values of the workflow steps

As a reminder, you can:

Installation

  1. First, you will need to install MLRun, Gradio and SQLAlchemy and add tokens. The project is created in the Notebook.

Data Generation Pipeline

  1. Now it’s time to generate call data. You can skip this if you already have your own audio files for analysis. We also have saved generated data in the Git repo you can use, enabling you to run the demo without an OpenAI key.

This comprises six steps, some of which are based on MLRun’s Function Hub:

The resulting workflow will look like this:

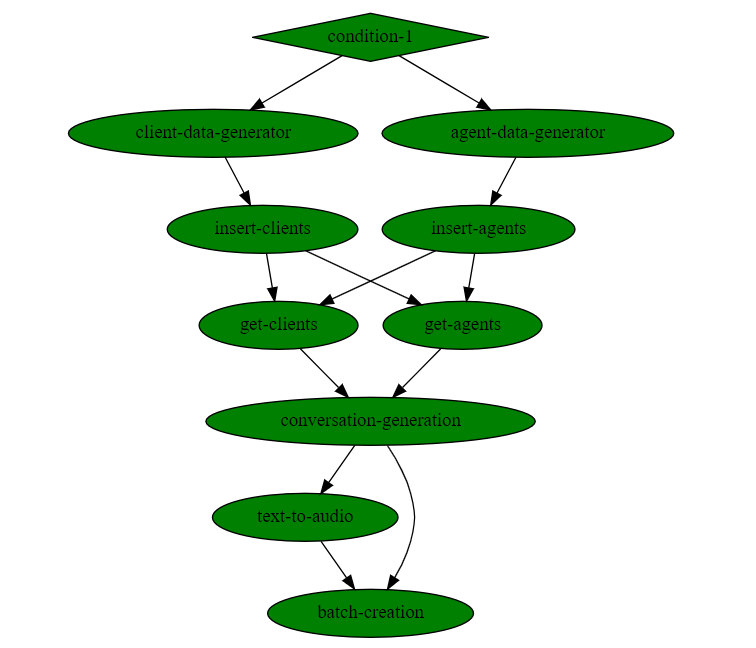
As you can see, no code is required. More details on each step and when to use them, in the documentation.

  1. Run the workflow by calling the project’s method project.run. You can also configure the workflow with arguments.

Data Analysis Pipeline

  1. Now it’s time for the data analysis pipeline. The steps in this pipeline are:
  • Inserting calls
  • Diarization
  • Transcription
  • PII recognition
  • Analysis
  • Post-processing

And it looks like this:


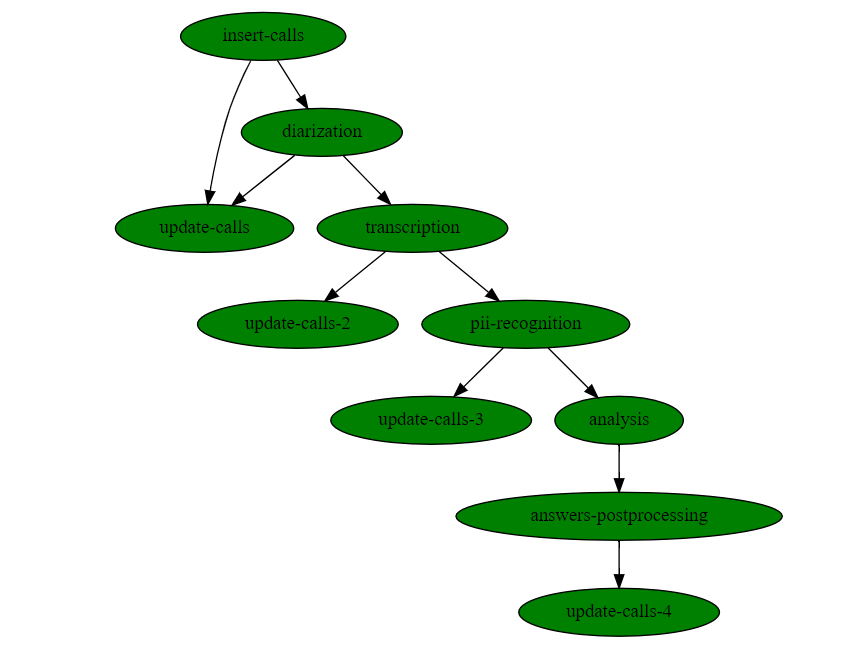
Similarly, no coding is required here either.

  1. Run the workflow and view the results.

Here’s how some of the steps are executed:

  • Analysis – Generating a table with the call summary, its main topic, customer tone, upselling attempts and more:

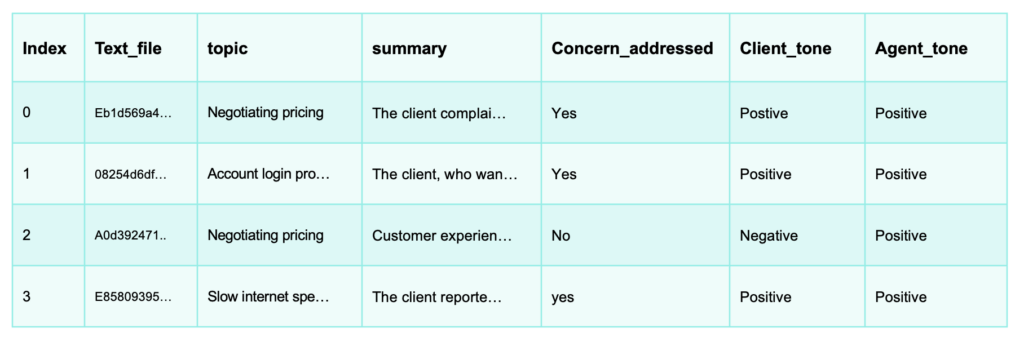
6. You can also use your database and the calls for developing new applications, like prompting your LLM to find a specific call in your call database in a RAG based chat app.To hear what a real call sounds like, watch the video of this tutorial.

Advanced MLRun Capabilities

In addition to simplifying the building and running of the pipelines, MLRun also allows auto logging, auto distribution and auto scaling resources.

Try MLRun for yourself.

Recent Blog Posts
MLRun v1.8 Release: with Smarter Model Monitoring, Alerts and Tracking
MLRun v1.8 adds features to make LLM and ML evaluation and monitoring more accessible, practical and...
Gilad Shaham
June 13, 2024
Fine-Tuning in MLRun: How to Get Started
How to fine tune an existing LLM quickly and easily with MLRun, with two practical hands-on examples...
Nick Schenone
June 13, 2024
Bringing (Gen) AI from Laptop to Production with MLRun
Find out how MLRun replaces manual deployment processes, allowing you to get from your notebook to p...
Gilad Shapira
June 13, 2024