Introducing MLRun v1.10: Build better agents, monitor everything
We’re proud to announce a series of advancements in mlrun v1.10 designed to power your end-to-end orchestration layer for agentic AI applications.


At MLRun, we’re proud to announce a series of advancements in MLRun v1.10 designed to power your end-to-end orchestration layer for agentic AI applications. From a powerful and versitile prompt engineering upgrade, support for remote models and a brand new interface to monitor agent performance, MLRun is continuously evolving to meet the demands of cutting-edge AI applications.
Prompt engineering is at the heart of agentic AI, but it’s often messy and hard to scale. That’s why we’re introducing the LLM Prompt Artifact: a new way to turn each LLM + prompt + configuration into a reusable, version-controlled and production-ready building block.
For teams building complex gen AI pipelines, where each task might use a different prompt or model, this feature gives you the flexibility to experiment and optimize at every step, while keeping your workflows clean and production-ready.
With LLM Prompt Artifacts, you can:
The LLM Prompt Artifact turns prompt engineering into a structured, repeatable process, making it easier to build, test, and deploy agents that work.

While monitoring deterministic AI systems is fairly straightforward, monitoring gen AI systems is new and complex territory. The AI monitoring ecosystem doesn’t offer a one size fits all solution, and many use cases call for a mix of different tools that can account for guardrails, hallucinations, compliance, security risks and performace degradation over time. One of MLRun’s main strengths is its open architecture, which lets you integrate with any third-party service. With MLRun you can integrate a custom monitoring set up that goes well beyond standard built-in dashboards.
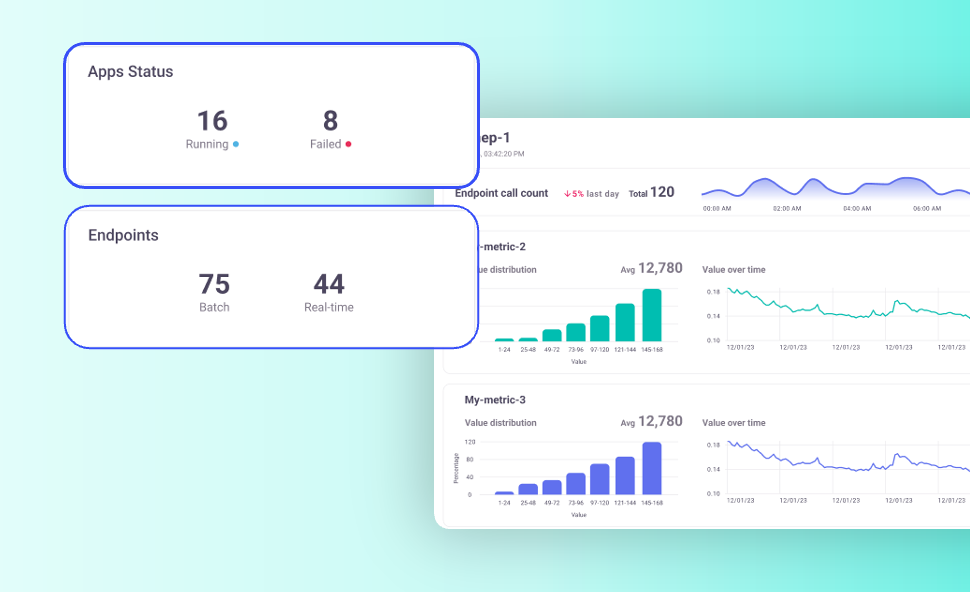
As part of our ongoing work on the future of monitoring for gen AI, MLRun v1.10 introduces the Monitoring Applications view: a single, centralized dashboard that consolidates all your monitoring apps into one place. Instead of jumping between tools or manually checking individual apps, you now have a unified view of their status, activity, and results.
With this new UI, you can:
This dashboard gives you the tools to monitor and refine every part of the process, from prompt engineering to model evaluation. Now you can confidently deploy and scale agentic AI systems with the data to continuously improve them.
Agentic AI often requires combining the best tools and models from multiple sources, whether they’re stored locally or hosted on platforms like Hugging Face. But managing these external models can quickly become a headache, with duplicated files, scattered tracking, and unnecessary storage costs. Now, you can register and manage these remote models directly in MLRun without duplicating files or uploading them to your datastore.
With this feature, you can:
Need to run batch inference, scheduled evaluations, or one-time scoring tasks? With MLRun v1.10, you can now deploy serving graphs as Kubernetes jobs. This makes it easy to evaluate multiple prompts, compare agents in parallel, or run bulk tasks without spinning up unnecessary infrastructure.
MLRun v1.10 is more than just a version update, it’s a toolkit for building smarter, faster, and more reliable agentic AI applications. Beyond these features, this release is full of numerous bug fixes, documentation improvements and user requests. We want to extend a huge thank you to the MLRun community for your contributions and feedback.
Stay tuned for the next round of improvements. Ready to get started with MLR v1.10? Check out the release notes for more details, or dive into the docs to start exploring the new features.
We can’t wait to see what you build with MLRun v1.10. As always, we’re here to support you every step of the way.
Happy building!
The MLRun Team

MLRun Community Edition (CE) is the out-of-the-box solution of MLRun for AI and ML orchestration and model lifecycle management.
MLRun CE can be installed directly on your Kubernetes cluster or even on your local desktop. It provides a complete, integrated MLOps stack that combines MLRun’s orchestration power with Nuclio’s high-performance serverless engine, along with additional tools for data storage, monitoring, and more.
In this blog, we’ll explain how MLRun CE works and recommended use cases, and share how one of our users leverages MLRun CE for experiment and model tracking.
MLRun CE is ready to use out of the box. It is designed to simplify the entire lifecycle of LLM and ML projects, and provides a robust solution for complex MLOps needs (see examples below).
By easily installing the MLRun CE Helm chart on your Kubernetes cluster or local desktop, you get a powerful, integrated environment for development. The platform is built on two cores: MLRun for MLOps orchestration and Nuclio for serverless computing.
MLRun is the MLOps orchestration framework that automates the entire AI pipeline, from data preparation and model training to deployment and management. It automates tasks like model tuning and optimization, enabling you to build and monitor scalable AI applications. With MLRun, you can run real-time applications over elastic resources and gain end-to-end observability.
Nuclio is a high-performance serverless framework that focuses on data, I/O, and compute-intensive workloads. It is the engine that powers the real-time functions within MLRun. Nuclio allows you to deploy your code as serverless functions, which are highly efficient and can process hundreds of thousands of events per second. It supports various data sources, triggers, and execution over CPUs and GPUs. It also supports real-time serving for generative AI use cases.
MLRun CE easily integrates with several other tools. It includes an internal JupyterLab service for developing your LLM code and supports Kubeflow Pipelines workflow for creating multi-step AI pipelines. It also works with Kafka and TDengine for robust, real-time and batch model monitoring, and provides built-in support for Spark and Grafana for data processing and visualization.
Data and developer users of MLRun CE can benefit from:
Seamless Integrations: The platform integrates with a wide range of popular open-source tools, including Kubeflow Pipelines for workflow management, and Spark and Grafana for data processing and visualization. This open architecture gives you the flexibility to use the tools you already know and love.
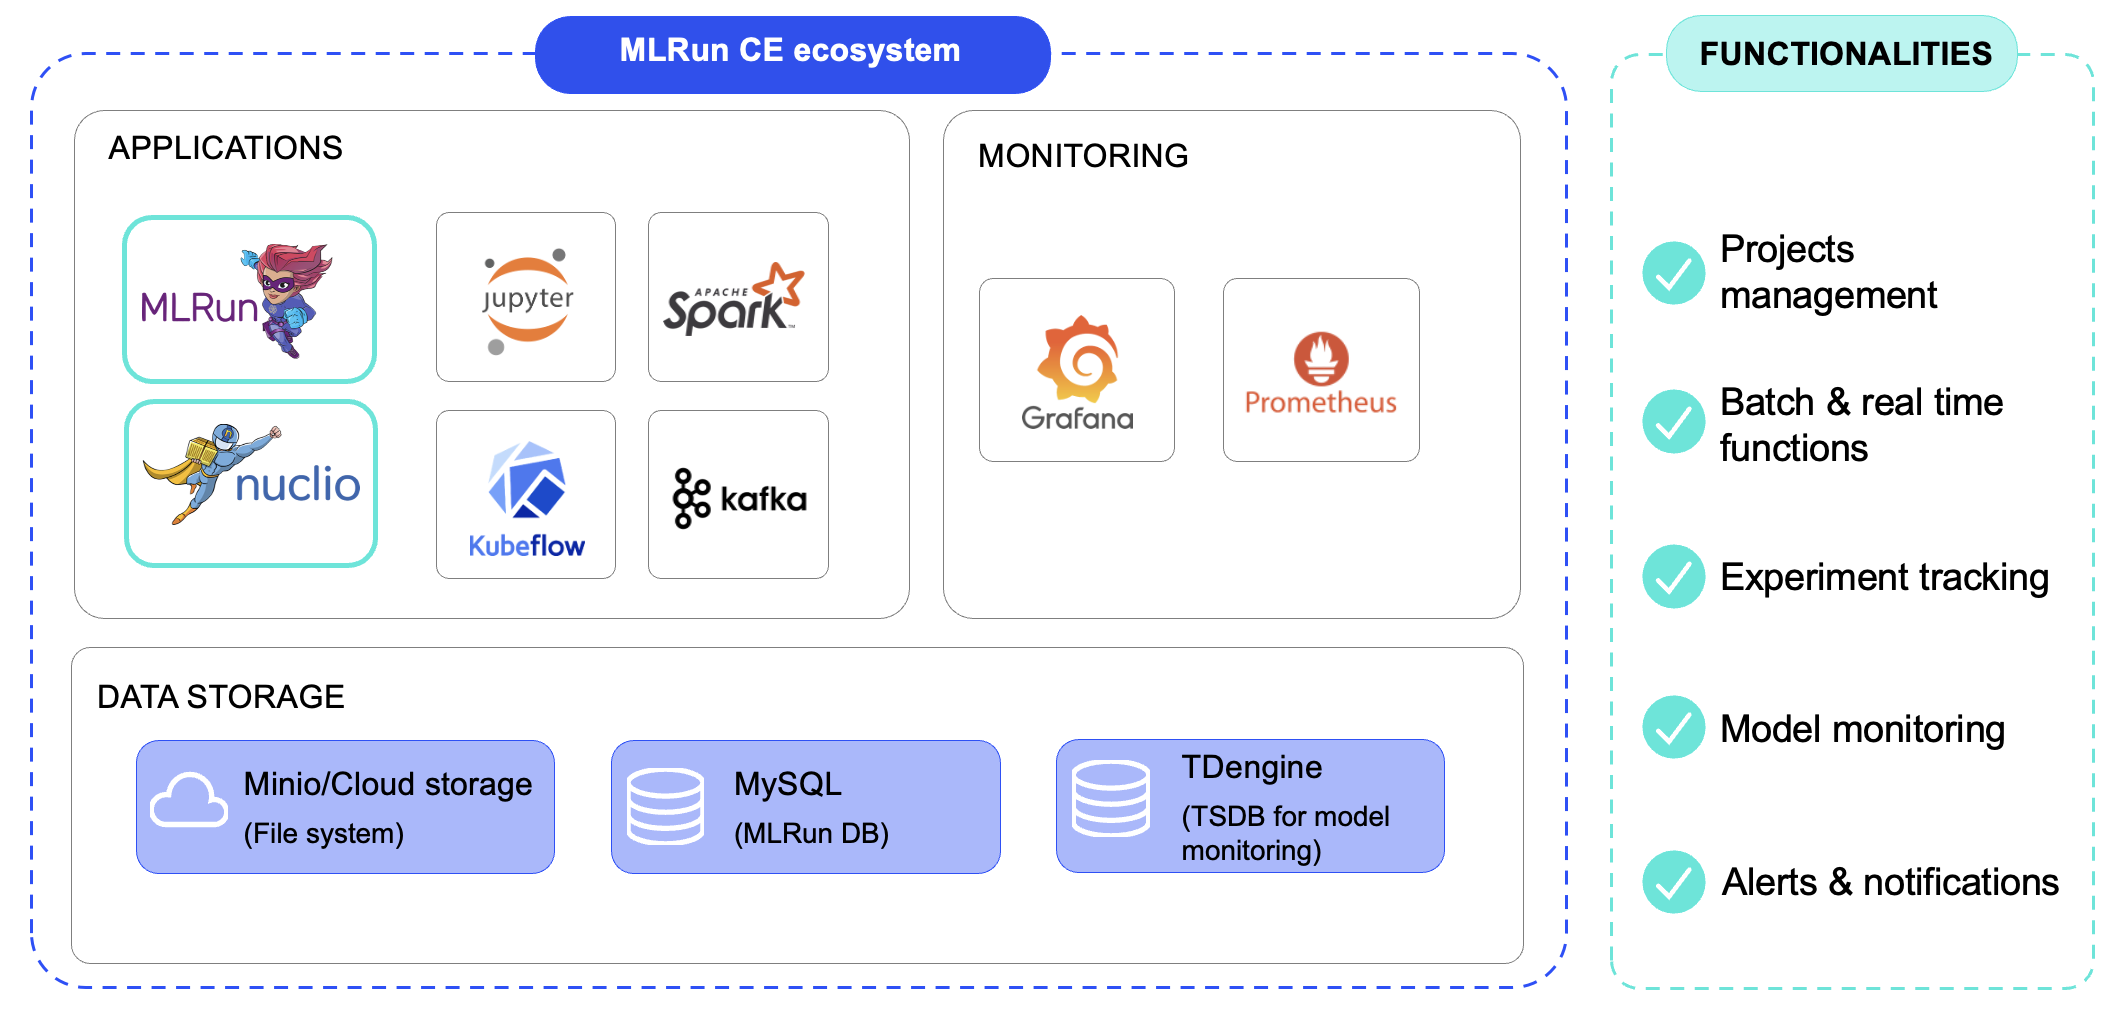
The following are the components that get installed when installing MLRun CE
The picture below describes the relations between them. MLRun is the orchestrator and deploy function by using MLRun, Nuclio, Spark and MPI jobs runtimes. Grafana is used to monitor usage, Jupyter for out-of-the-box development platforms and Minio, MySQL & TDengine to store data.
MLRun CE can be used for a wide variety of MLOps use cases. In particular:
One of our community users has adopted MLRun CE as their MLOps platform to deploy, track, and manage their ML training experiments and models. MLRun CE is deployed across Kubernetes environments.They run two main types of ML workflows run through MLRun CE. The first is manually triggered training jobs. MLRun CE runs the training function, logs metrics and datasets, and registers the model for deployment on edge devices.
The second is automated periodic insight models, such as drift detection functions that compare recent data against training distributions and generate alerts when anomalies occur.
The team relies on MLRun CE’s full set of components: project management, batch functions, experiment tracking, model monitoring, and alerts.
With MLRun CE, their data science teams can:
Check out these resources for more information:

MLRun is an open-source MLOps and gen AI orchestration framework designed to manage and automate the machine learning lifecycle. This includes everything from data ingestion and preprocessing to model training, deployment and monitoring, as well as de-risking. MLRun provides a unified framework for data scientists and developers to transform their ML code into scalable, production-ready applications.
In this blog post, we’ll show you how to get started with MLRun: creating a dataset, training the model, serving and deploying. You can also follow along by watching the video this blog post is based on or through the docs.
When starting your first MLRun project, don’t forget to star us on GitHub.
Now let’s get started.
An MLRun project helps organize and manage the various components and stages of an ML or gen AI workflow in an automated and streamlined manner. It integrates components like datasets, code, models and configurations into a single container. By doing so, it supports collaboration, ensures version control, enhances reproducibility and allows for logging and monitoring.
This will create the project object, which will be used to add and execute functions.
%%writefile data-prep.py
import pandas as pd
from sklearn.datasets import load_breast_cancer
def breast_cancer_generator():
“””
A function which generates the breast cancer dataset
“””
breast_cancer = load_breast_cancer()
breast_cancer_dataset = pd.DataFrame(
data=breast_cancer.data, columns=breast_cancer.feature_names
)
breast_cancer_labels = pd.DataFrame(data=breast_cancer.target, columns=[“label”])
breast_cancer_dataset = pd.concat(
[breast_cancer_dataset, breast_cancer_labels], axis=1
)
return breast_cancer_dataset, “label”
This is regular Python. MLRun will automatically log the returning data set and a label column name. 4. Create an MLRun function using project.set_function, together with the name of the Python file and parameters specifying requirements. These could include running the function as a job with a certain Docker image.
data_gen_fn = project.set_function(
“data-prep.py”,
name=”data-prep”,
kind=”job”,
image=”mlrun/mlrun”,
handler=”breast_cancer_generator”,
)
project.save() # save the project with the latest config
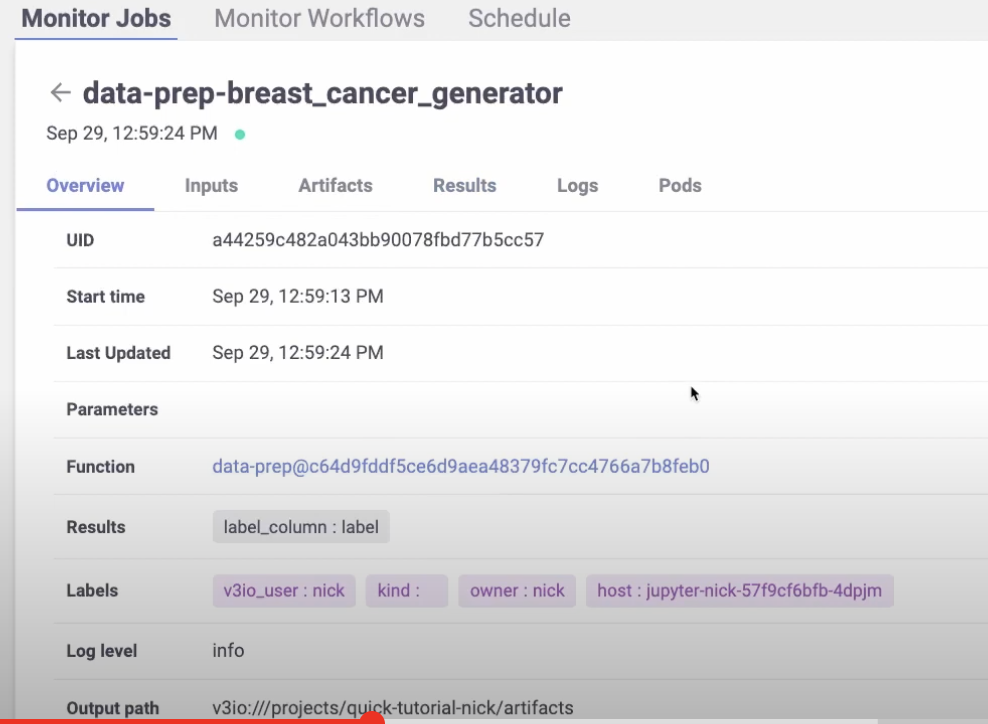
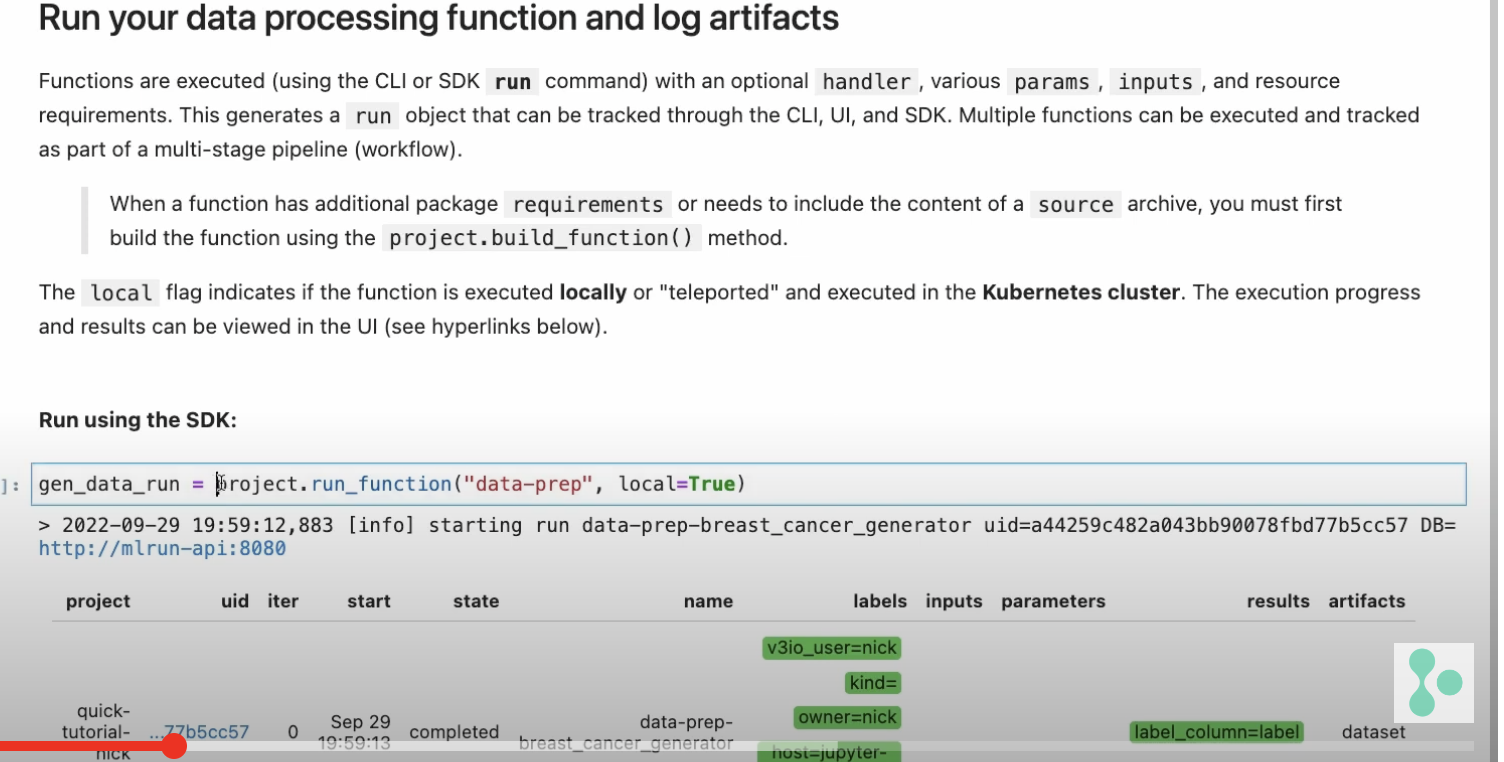
gen_data_run = project.run_function(
“data-prep”,
local=True,
returns=[“dataset”, “label_column”],
)
Now let’s see how to train a model using the dataset that we just created. Instead of creating a brand new MLRun function, we can import one from the MLRun function hub.
Here’s what it looks like:
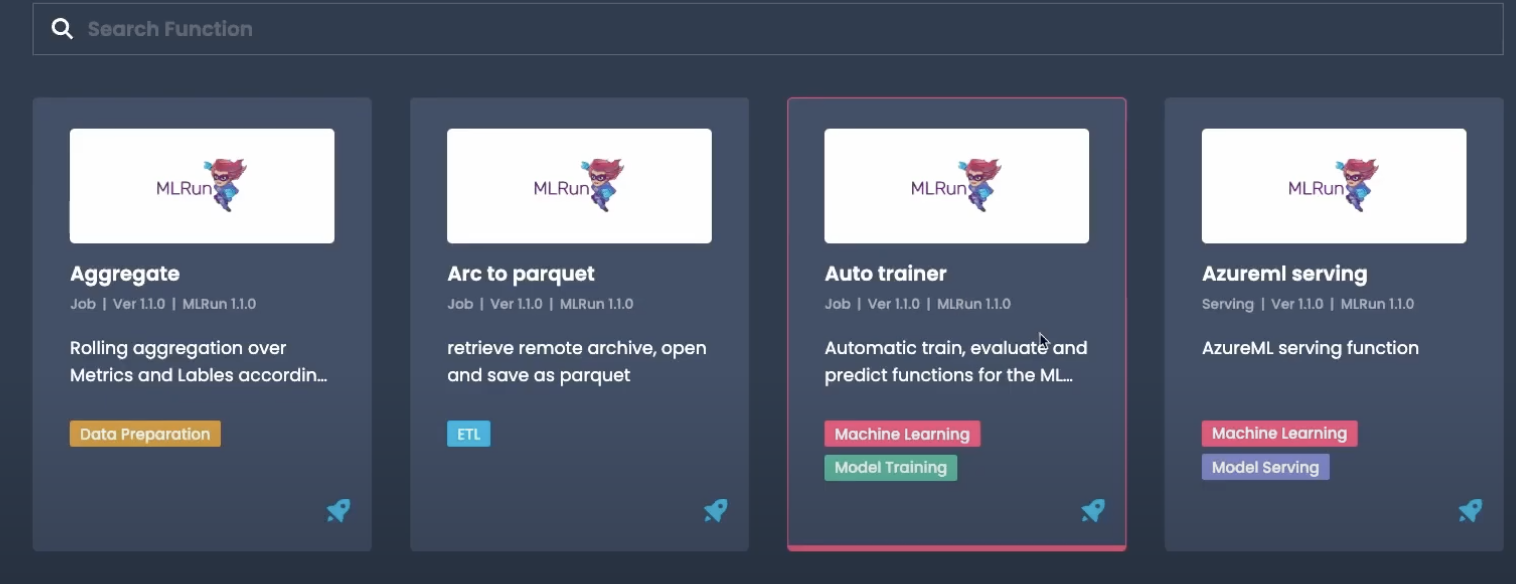
You will find a number of useful and powerful functions out-of-the-box. We’ll use the Auto trainer function.
# Import the function
trainer = mlrun.import_function(“hub://auto_trainer”)
In this case, one of the parameters is the data set from our previous run.
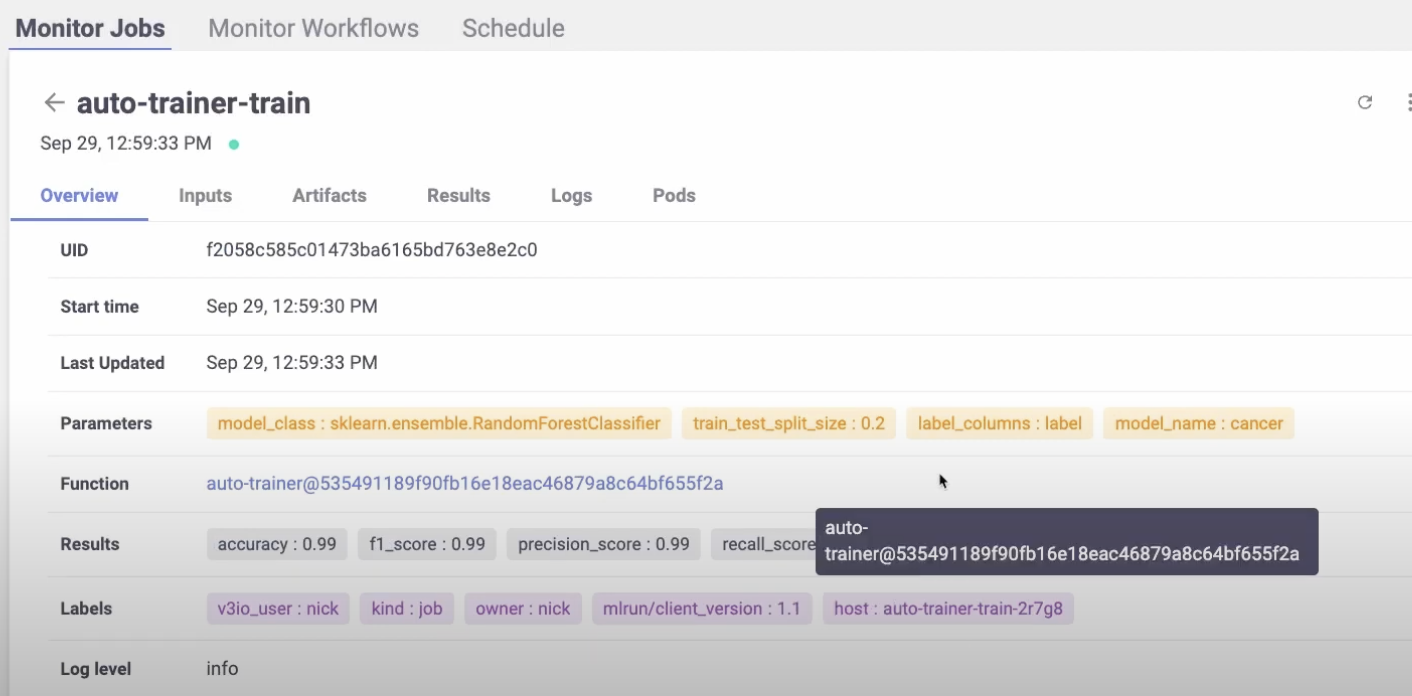
trainer_run = project.run_function(
trainer,
inputs={“dataset”: data_prep_run.outputs[“dataset”]},
params={
“model_class”: “sklearn.ensemble.RandomForestClassifier”,
“train_test_split_size”: 0.2,
“label_columns”: data_prep_run.results[“label_column”],
“model_name”: “breast_cancer_classifier”,
},
handler=”train”,
)
The default is local=false, which means it will run behind the scenes on Kubernetes.
You will be able to see the pod and the print out statements.
Now we can serve the trained model.
serving_fn = mlrun.new_function(
“breast_cancer_classsifier_servingserving”,
image=”mlrun/mlrun”,
kind=”serving”,
requirements=[“scikit-learn~=1.3.0”],
)
serving_fn.add_model(
“breast_cancer_classifier_endpoint”,
class_name=”mlrun.frameworks.SKLearnModelServer”,
model_path=trainer_run.outputs[“model”],,
)
In this example, we are using sklearn. But you can choose your preferred framework from this list:
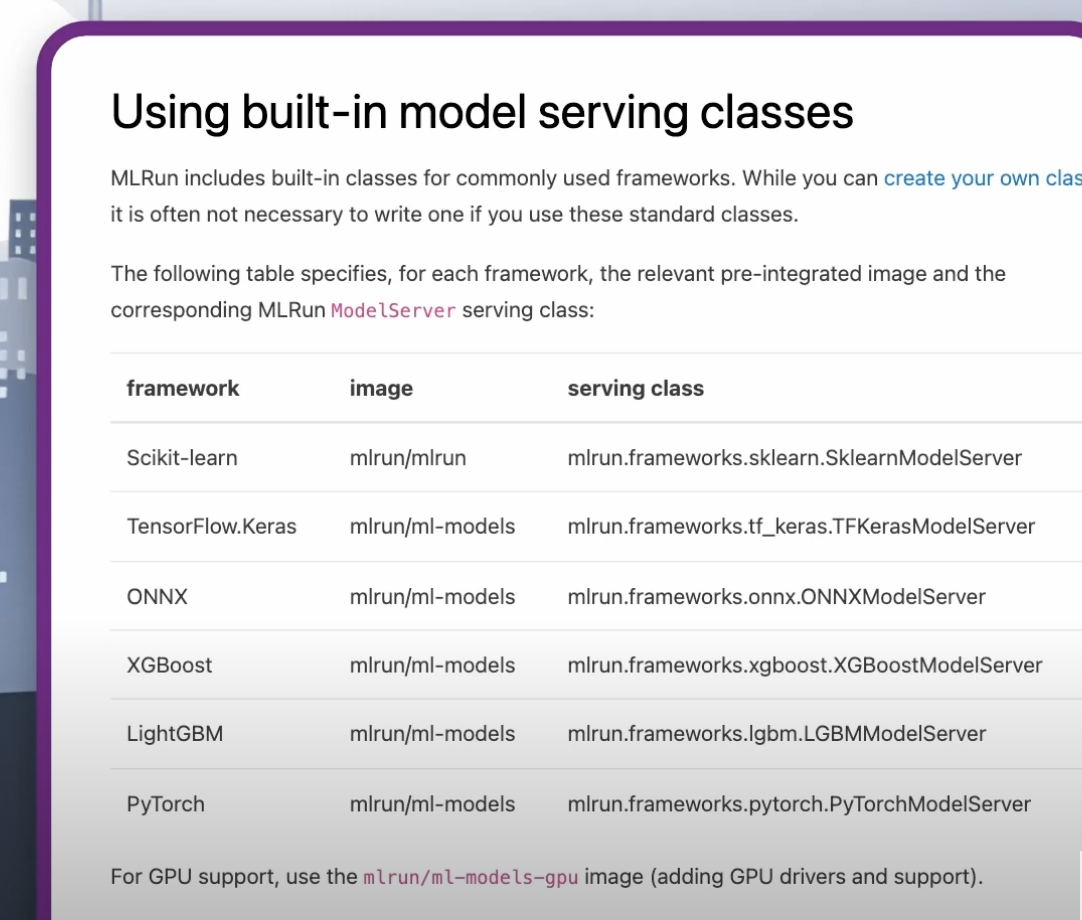
Or customize your own. You can read more about this in the docs.
The example below shows a simple, singular model. There are also more advanced models that include steps for data enrichment, pre-processing, post-processing, data transformations, aggregations and more.
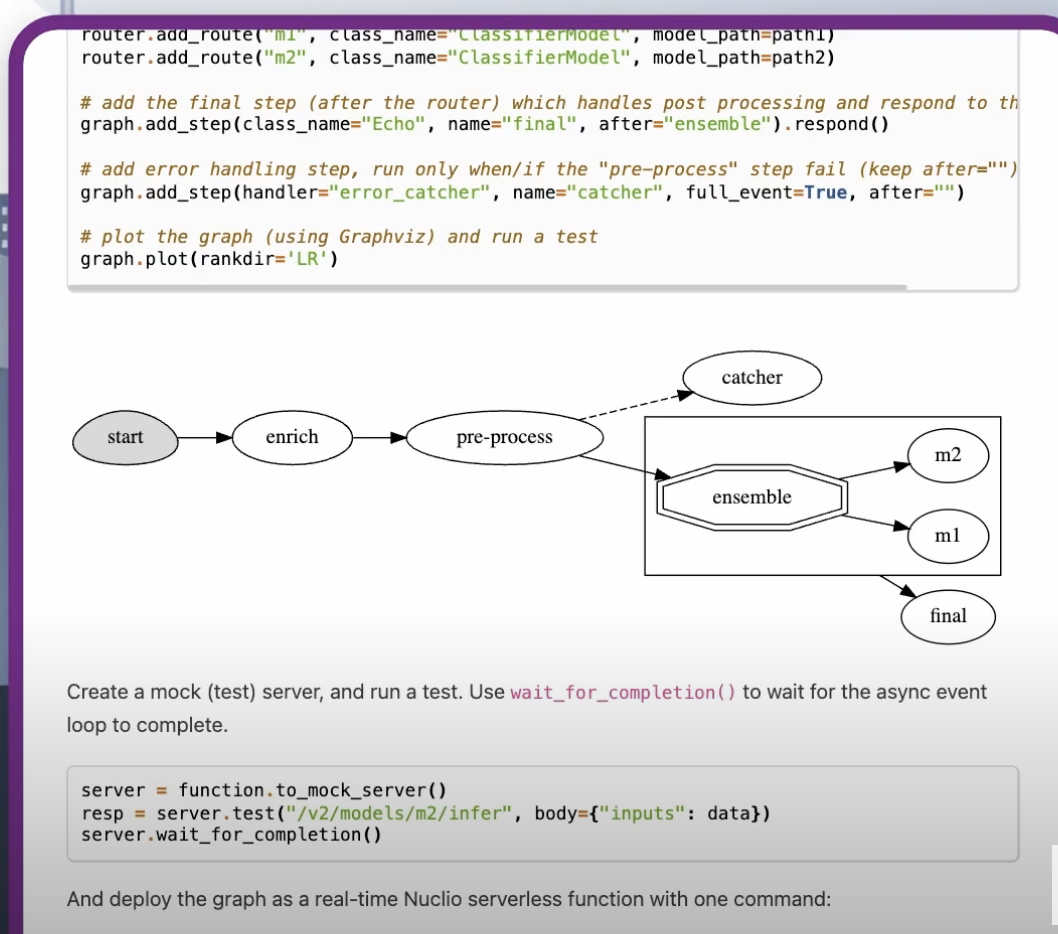
Read more about real-time serving here.
# Create a mock (simulator of the real-time function)
server = serving_fn.to_mock_server()
Use the mock server `test` method (server.test) to test the model server.
The last part of the code is the model server, which you can send data inputs to and acts exactly like a model server.
Finally, it’s time to deploy to production with a single line of code.
serving_fn.deploy()
This will take the code, all the parameters, the pre- and post-processing, etc., package them up in a container deployed on Kubernetes and expose them to an endpoint. The endpoint contains your transformation, pre- and post-processing, business logic, etc. This is all deployed at once, while supporting rolling upgrades, scale, etc.
That’s it! You now know how to use MLRun to manage and deploy ML models. As you can see, MLRun is more than just training and deploying models to an endpoint. It is an open source machine learning platform that helps build a production-ready application that includes everything from data transformations to your business logic to the model deployments to a lot more.
MLOps orchestration ties together all the moving parts of the AI/ML lifecycle into a coordinated, automated, scalable and responsible system. The critical components of MLOps orchestrations include data pipelines, model training and retraining workflows, CI/CD pipelines for automated deployment, and monitoring and governance layers.
Open-source MLOps tools provide transparency, flexibility, customization and cost efficiency. Moreover, open-source communities often move quickly to patch vulnerabilities, add features, and share best practices. This collaborative LLMOps ecosystem allows companies to future-proof with cutting-edge capabilities while retaining the ability to scale on their own terms.
Most orchestration frameworks are designed with modularity and extensibility in mind. They typically expose APIs, SDKs, and plugins that let you connect to existing data lakes, warehouses, message queues, monitoring systems, and CI/CD tools. You can also choose AI components for your LLMOps workflows like models you want to use, model connectors, etc.
Post-deployment monitoring involves tracking both technical and business performance of your models. Monitor metrics like latency, throughput, error rates, and resource utilization to ensure the model is serving predictions efficiently. On the data side, monitoring for data drift, concept drift, hallucinations and feature integrity ensures the model remains accurate as real-world inputs evolve. Open-source MLRun supports monitoring with internal dashboards or integrations with external reporting tools.
MLRun is designed to be highly versatile, supporting a wide spectrum of models and workloads. You can deploy traditional machine learning models (e.g., scikit-learn, XGBoost), deep learning frameworks (TensorFlow, PyTorch, Keras), as well as modern NLP and generative AI models. Beyond this, MLRun also supports deployment of custom inference logic, streaming pipelines, and ensemble models, giving teams the flexibility to adapt to different business domains.
We’ve integrated MLRun with NVIDIA NeMo microservices, to extend NVIDIA’s Data Flywheel Blueprint. This integration lets you automatically train, evaluate, fine-tune and monitor AI models at scale, while ensuring low latency and reduced resource use. Read on for all the details:
NVIDIA NeMo is a modular microservices platform for building and continuously improving agentic AI systems.
It provides:
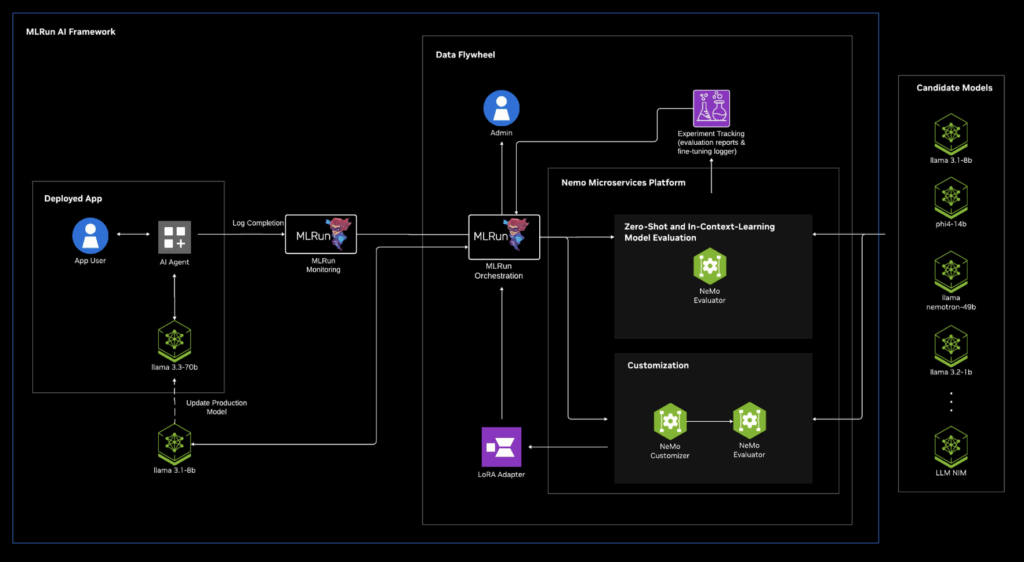
How the integration works:
Use case example:
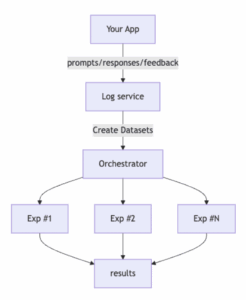
Let’s say we want to improve a small model’s performance to match a larger model. The data Flywheel runs experiments against production logs against candidate models and surfaces efficient models that meet accuracy targets.
Explore the joint Iguazio MLRun and NVIDIA blueprint to try for yourself.

LLMs can be used for evaluating other models, which is a method known as “LLM as a Judge”. This approach leverages the unique capabilities of LLMs to assess and monitor the performance and accuracy of models. In this blog, we will show a practical example of operationalizing and de-risking an LLM as a Judge in with the open-source MLRun platform.
“LLM as a judge” refers to using LLMs to evaluate the performance and output of AI models. The LLM can analyze the results based on predefined metrics such as accuracy, relevance, or efficiency. It may also be used to compare the quality of generated content, analyze how models handle specific tasks, or provide insights into strengths and weaknesses.
LLM as a Judge is an evaluation approach that helps bring applications to production and derives value from them much faster. This is because LLM as a Judge allows for:
When using a Large Language Model (LLM) as a judge for evaluating other models, several significant risks must be carefully considered to avoid faulty conclusions:
Addressing these risks requires thorough validation, human oversight, careful design of evaluation criteria and evaluating the model Judge for the task. This will ensure reliable and fair outcomes when using an LLM as an evaluator.
In this example, we’ll show how to implement LLM as a Judge as part of your monitoring system with MLRun. You can view the full steps with code examples here.
Here’s how it works:
To prompt engineer the judge you can follow the best practices here:
LLM as a Judge allows teams to evaluate outputs automatically, at scale, instead of relying solely on manual human review. This continuous testing of responses accelerates the transition from prototyping to production. It also reduces costs by filtering poor outputs early, so developers only spend time fine-tuning models that meet baseline performance standards.
One of the biggest risks is bias or inconsistency in the “judge” model itself. To mitigate this, teams should use human-in-the loop, prompt engineering and regular monitoring of the judge. This helps ensure the Judge remains reliable over time.
1) Different LLMs may rate the same output differently, making reproducibility difficult. 2) LLM judgments can lack transparency, so it’s not always clear why a certain score was assigned, complicating debugging. 3) Running an LLM-as-a-Judge across large datasets or real-time applications requires significant compute resources. 4) Aligning the judge’s criteria with business metrics.
Define clear evaluation criteria, create evaluation prompts for the judge model that instruct it to assess outputs based on those criteria, and implement evaluation pipelines where candidate outputs are scored, logged, and compared to historical benchmarks. Tools like MLRun or custom dashboards can help manage experiment tracking, metrics aggregation, and governance.
LLM evaluation metrics vary by use case but typically include accuracy (correctness of outputs), relevance (how well the response addresses the query), fluency (clarity and coherence of text), and safety (absence of harmful or policy-violating content). More advanced systems also measure factual consistency (alignment with ground truth), helpfulness (practical utility to the user), and bias/fairness indicators. In generative scenarios, metrics like diversity, creativity, or engagement may be tracked.
LLM as a Judge is a useful method that can scale model evaluation. With MLRun, you can quickly fine-tune and deploy the LLM that will be used as a Judge, so you can operationalize and de-risk your gen AI applications. Follow this demo to see how.
Just getting started with gen AI? Start with MLRun now.

Fine-tuning is the practice of training a pre-existing AI model on new, focused data. By enhancing the model’s domain-specific performance, organizations can make their LLMs production-ready and turn their generative AI applications into a competitive differentiator. In this blog, we’ll explore how MLRun simplifies and accelerates fine-tuning workflows with two practical, hands-on examples, which you can easily follow and replicate.
Fine-tuning is a machine learning method where a pre-trained model is further trained on a specialized dataset to adapt it to specific tasks or domains. Fine-tuning involves modifying the model’s internal parameters based on new data (rather than the model’s output), to enhance its performance for particular applications. This makes the model more specialized for specific tasks and valuable for business use cases.
Fine-tuning is considered a resource-efficient method because it leverages pre-trained models, rather than having to train a new model from scratch. However, resources for the fine-tuning process itself need to be managed efficiently to ensure cost-effectiveness.
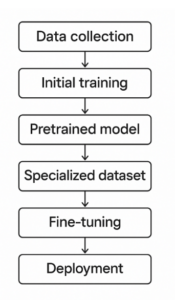
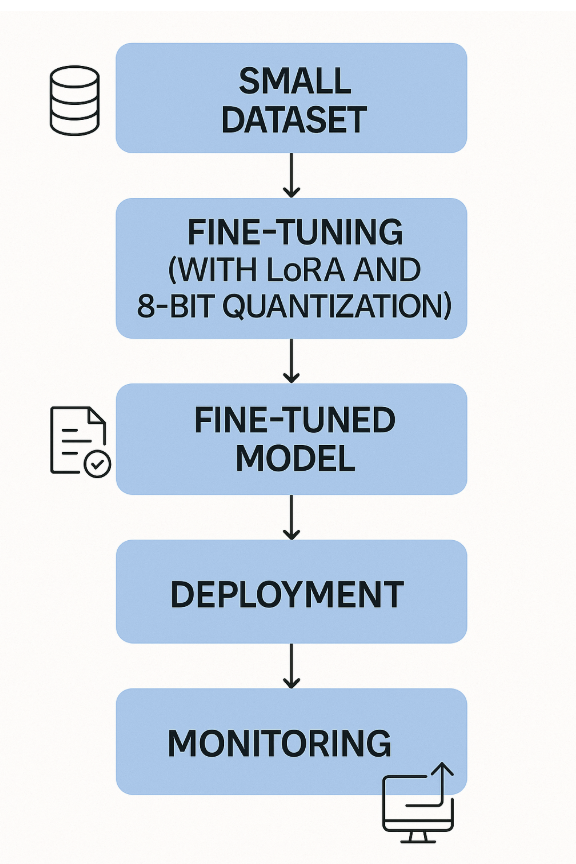
In AI pipelines, fine-tuning takes place in the development pipelines, after data is collected and initial models are trained. Before deploying the model, it’s recommended to evaluate the fine-tuned model and ensure it meets required standards.
MLRun provides pre-made functions that will tune, track the model/dataset, dynamically allocate GPUs in a K8s cluster, etc. Then, MLRun can be used to serve the newly fine tuned model at an endpoint. MLRun can then be used to monitor the model over time with custom metrics/guardrails (see example #1 below).
You can find these functions in these resources. Below we show examples of how to fine-tune with MLRun. There are also more demos and resources in the end:
Let’s take a look at two examples of how to fine-tune with MLRun. Follow along with the tutorials on your own:
Fine-tuning can take place after an application is developed and in the monitoring phase. By observing how the model performs in production, such as how it handles edge cases, evolving user behavior, or domain-specific nuance, teams can fine-tune the model to correct drift, improve accuracy and adapt to changing conditions.This ongoing refinement ensures the model stays aligned with business goals and user expectations over time, allowing for continuous improvement based on real-world feedback.
Here’s how it works:
This setup creates a continuous learning loop where the model self-corrects based on real-world usage, ensuring it stays aligned with domain-specific behavior.
In this example, with a banking gen AI chatbot, the application is evaluated to ensure the chatbot only responds to banking-related queries. If it answers irrelevant questions, an automated feedback loop using ORPO kicks in to fine-tune and redeploy the model.
(ORPO (Odds Ratio Preference Optimization) integrates supervised fine-tuning (SFT) and preference alignment by leveraging a simple log odds ratio term to create a penalty for disfavored responses and a strong adaptation signal for the chosen response. This approach is computationally efficient and doesn’t require a separate reference model or reward model, making it a simpler and more powerful alternative to methods like DPO or RLHF.)

Fine-tuning can help adapt a model to a required use case, before application deployment. This allows for more accurate, relevant and context-aware responses tailored to the specific needs of the target domain or user group.
Here’s how it works:
This is ideal for quick iterations, experimentation with model behavior (e.g., tone or persona), or domain adaptation without full-scale retraining.
In this example, the model’s outputs are transformed to emulate a specific tone of voice (in this example – pirate speak). The pre-trained LLM (LLaMA 2 7B) is fine-tuned using a customized dataset (Databricks Dolly-15k).
More Resources:

Today we’re announcing MLRun 1.8, now available to the community. This latest version adds to the series of improvements to LLM monitoring released in 1.7, with in-platform alerts. Plus, several more improvements to help to track and evaluate models, and navigate the platform with ease.
Read all the details below:
MLRun v1.7 introduced a flexible monitoring infrastructure, the ability to monitor unstructured data, metrics customization, and more.
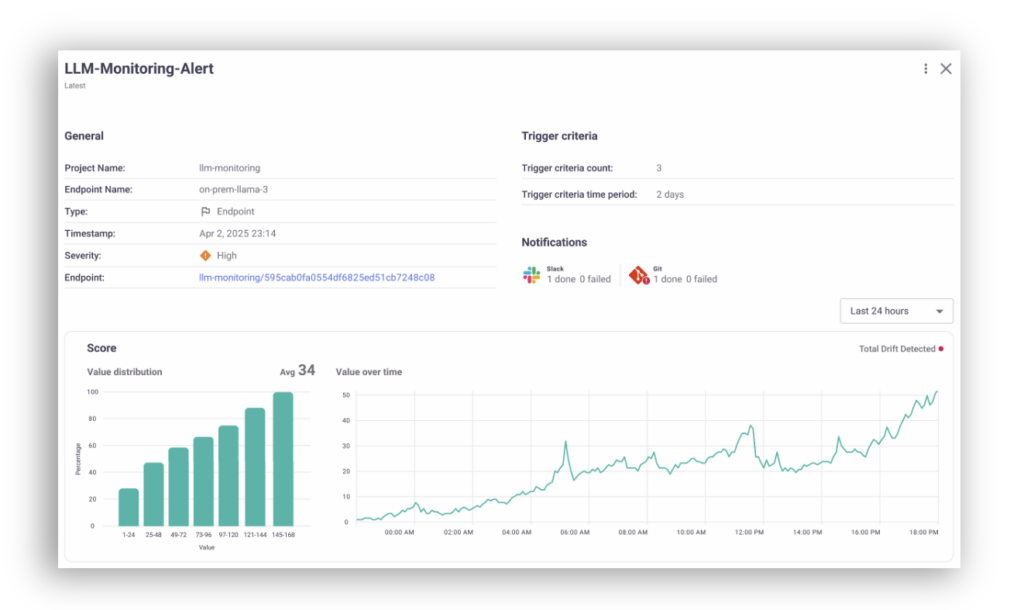
MLRun v1.8 builds on these capabilities and now includes monitoring alerts built into the MLRun UI.
Users can set up alerts on criteria such as:
Once alerted, users can click through to the flagged issues and investigate directly in MLRun, without having to context switch to external monitoring systems.
Experiment tracking is used to measure metrics, compare results, reproduce experiments and optimize models. This is a core MLRun capability.
Now, MLRun v1.8 supports experiment tracking for document-based models, like LLMs. This is enabled through the LangChain API, which is integrated into vector databases.
Users can track their documents as artifacts, with metadata like:
Debugging LLMs is a complicated process. It requires: 1) Deployment 2) Realizing there’s an issue 3) Identifying the root cause 4) Analysis and evaluation 5) Fixing 6) Redeploying. This process is long, technologically complex and resource-intensive. It’s also prone to potential errors.
In MLRun v.1.8, this process is shorter and more resource-efficient. Users can now monitor and evaluate models before deploying them. MLRun runs the model, returning performance results without consuming unnecessary compute resources.
Managing large-scale projects across teams requires a reliable and user-friendly system.
Following user requests, MLRun v1.8 includes pagination, to enhance responsiveness and reduce scrolling and performance bottlenecks arising from long page loading times.
What’s your feedback on MLRun 1.8? Join the community and share your insights and requirements for future releases.
Explore MLRun 1.8.

MLRun is an open-source framework that orchestrates the entire generative AI lifecycle, from development to deployment in Kubernetes. In this article, we’ll show how MLRun replaces manual deployment processes, allowing you to get from your notebook to production in just a few lines of code.
As a data professional, you’re probably familiar with the following process:
The traditional process described above is fraught with challenges:
MLRun addresses these challenges by allowing you to easily run your local code in K8s production environments as a batch job or a remote real-time deployment. MLRun eliminates the need to worry about the complexity of Kubernetes, abstracting and streamlining the process. MLRun also supports scaling and configuring resources, such as GPU, Memory, CPU, etc. It provides a simple way to scale resources, without requiring users to understand the inner workings of Kubernetes.
What’s left is simply to monitor the functionality and behavior of your AI system once it’s live, which can also take place in MLRun.
Here’s how MLRun achieves this:
Here’s what the same process looks like, but with MLRun:
| Before MLRun | After MLRun |
| You want to run a batch fine-tuning job for your LLM, but your code requires a lot of memory, CPU, GPUs. It also needs a number of Python requirements packages to run and fine-tune the LLM. | By using MLRun this flow is very simple. You only need to connect your local IDE to MLRun, create a project, create an MLRun function set and run your code using the relevant resources. With this flow, you can develop and run your code in a Kubernetes from the beginning of the development phase with only a few code lines. |
| You must run your code on your K8s cluster because your local computer doesn’t have enough resources. For this, you need to create a K8s resource and maybe a new Docker image with the new Python requirements. | To run your code in a Kubernetes cluster, create an MLRun function that runs your Python code. Then, add the amount of resources (memory, CPU and GPU), and add Python requirements. MLRun will use those values and run your fine-tuning job in Kubernetes and manage the deployment. |
| Once you’ve successfully run the function on the K8s cluster, you need to version and track your experiment results (LLM and the fine-tune job results). This is essential to understand where and why you need to improve your fine-tune job. | Now that you have a model that has been fine-tuned by the MLRun function, you can track the model artifact as part of the MLRun model artifactory, with the model version, labels or the model metrics. |
| In some projects, the model inference is done in a batch, in others it’s in real-time. If this is a real-time deployment, you need to create a K8s resource that serves the model with the user prompts or create a batch job that does the same. Both should run in the K8s cluster for production testing, and you need to manage those resources by yourself. | In some projects, the model inference is done in a batch, in others it’s in real-time. In MLRun, you can do both. You can serve your LLM in real-time or collect the prompts and run the same in batch for the LLM evaluations, in just a couple of lines of code. |
| Once you serve the model, you need to monitor and test how your model is behaving and if the model outputs meet your criteria for deployment in production, using accuracy, performance or other custom metrics. | Once you serve the model, monitor your LLM outputs and inputs and check the model performance and usage by enabling MLRun model monitoring. This is an essential part of the model development, helping you better understand if you need to retrain the model or the model outputs so they meet your criteria for deployment in production. |
| Once your project is ready to deploy in production systems you need to run some of the steps above in the production cluster again | Once your project is ready for production, you can easily move your project from dev system and move the same project configuration to production system, by using MLRun CI/CD automation. |
MLRun can take your code and run and manage your functions and artifacts in Kubernetes environments from your first deployment. This allows you to focus on development and decreases the time needed to deploy AI projects in production, while maintaining a production-first mindset approach.
1. On your laptop, install MLRun and configure your remote environment. Now you have your MLRun environment ready to develop your project from your laptop to production.
2. Create your MLRun project by using the MLRun SDK.
3. Run your Python code as an MLRun function. For a remote or batch function you can run your code locally or on your k8s cluster from the beginning of the development phase (always keep production mindset approach). You can also log models and different artifact types to your system experiment tracking management.
4. Based on the run and the experiment tracking you can monitor your result and make the way to production more easy and convenient.
More Resources:
MLRun simplifies and automates the various stages of the AI lifecycle. Here are some key use cases where you can use MLRun:

A generative AI copilot is an interactive gen AI assistant that is designed to amplify human capabilities while working together interactively. The term “gen AI co-pilot” is inspired by the aviation concept of a copilot, who assists the main pilot to ensure smooth and successful flying. You can develop your own copilot with open-source MLRun, which will orchestrate the AI pipelines at scale with pre-built components.
In this blog post, we’ll dive into the concept of a gen AI copilot and show a demo of building one with MLRun.
A copilot in generative AI is an AI-powered assistant designed to work interactively and collaboratively with humans in real-time to enhance our capabilities. This could include conducting tasks like automating repetitive assignments, generating drafts, retrieving information, transcription of conversations, analyzing data, providing insights, writing and testing code, or generating content. With a copilot, we can work faster, more effectively and at a larger scale.
Some of the most popular copilots in use today are:
A gen AI copilot leverages LLMs to understand user input, process it, and generate relevant outputs for tasks such as answering questions, creating content, or writing code. It combines specialized tools or APIs to tailor responses. With RAG, it can also fetch and incorporate real-time data, ensuring accuracy and relevance.
The system adapts through user feedback, integrates with external tools for automation, and maintains privacy and compliance standards to deliver secure, efficient, and personalized assistance across various domains.
Workflows are the sequences of tasks or actions that the copilot automates or assists with, based on user input and specific goals. They typically involve multi-step operations, integrations with external tools, and contextual understanding to ensure tasks are completed effectively.
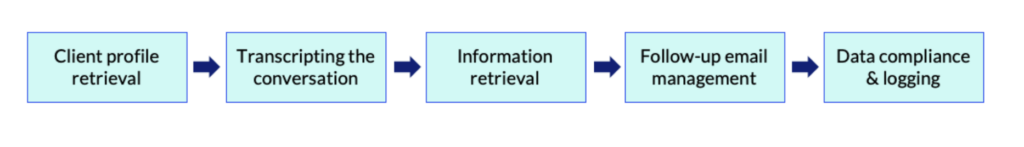
A customer support copilot, for example, might include the following workflows:
5. Data Compliance and Logging – Ensuring all client interactions adhere to regulatory standards. For example, automatically logging the client interaction into the organization’s system while ensuring compliance with data protection and regulatory standards (e.g., GDPR, HIPAA), flagging any sensitive or non-compliant elements for review and maintaining a secure audit trail for accountability.
MLRun is an open-source AI orchestration framework that simplifies and accelerates the development and deployment of AI models. Building a copilot with MLRun allows for:
Customer service copilots can serve multiple use cases, from a 24/7 support call center to escalation management to global multilingual support. In the example below, you can see a demo of an MLRun copilot. It shows what such a copilot could look like in a private banking client relationship management scenario.
Meet Miss Chen, who recently invested in green energy bonds and is looking for advice on reinvesting additional funds. Together with the copilot, the banker identifies and recommends a relevant investment opportunity based on the client’s history. In addition, the co-pilot helps the agent anticipate future opportunities, like biotech investments, based on client interests, which expands the bank’s role in the client’s portfolio.
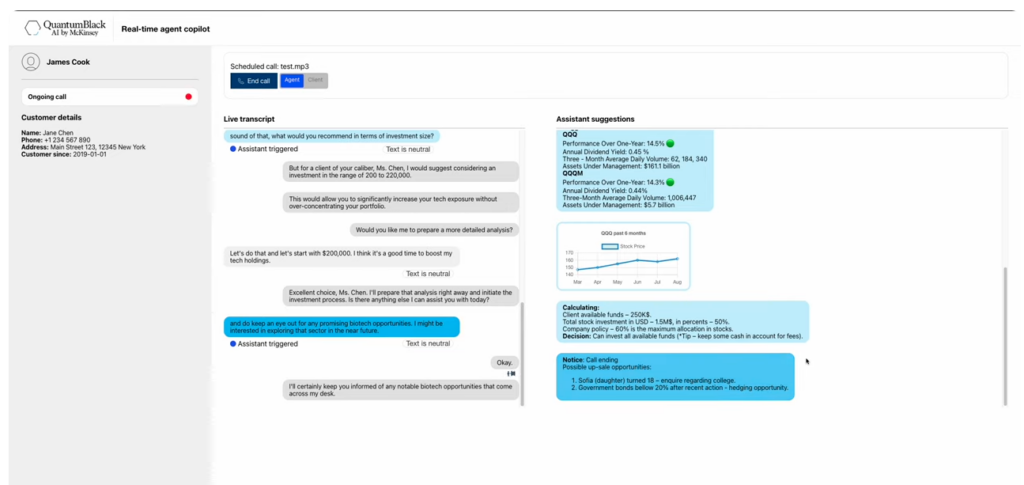
The banker also proactively shares research materials from reputable sources, retrieved by the copilot, to support informed decision-making. This fosters a sense of trust and expertise while generating more business for the bank.
The copilot emphasizes personalized service, strategic investment advice and proactive support for the client’s needs. It helps the human agent provide personal touches, such as acknowledging the client’s daughter’s achievements and offering tailored solutions, to build trust and loyalty. This long-term retention through proactive service ensures steady revenue from high-net-worth clients.
In the end, the co-pilot can create a hyper-personalized follow-up email based on the conversation for accountability and to close the deal.

As organizations transition from experimenting with LLMs to deploying gen AI applications and driving business value, data professionals face operationalization challenges. These include hallucinations, bias, model misuse, PII leakage, harmful content, inaccuracy, and more. Detecting and addressing these issues requires robust monitoring solutions in the AI pipeline.
By ensuring monitoring is part of AI pipeline orchestration, data professionals can implement a continuous feedback loop. The monitoring results can be used to fine-tune models, ensuring they are high-performing, reliable and accurate. This ensures risks are mitigated before reaching production, allowing for the integrity and operational stability of gen AI applications.
MLRun can integrate with any monitoring application, regardless of its ecosystem. This means users can use MLRun to orchestrate their gen AI application, including tasks like data preparation, model tuning, customization, validation and model optimization. Then, they can view monitoring results either in MLRun or their monitoring application of choice, and feed the results back to the AI pipeline.
Integrating MLRun with an external monitoring application is simple and straightforward. Here’s how it works:
Integrating with your monitoring application takes place through their SDK or API. Explore and identify your application’s SDK or find the API endpoints, request payloads and response structure in the documentation.
In MLRun, implement a Python class that inherits from MLRun’s ModelMonitoringApplication base class.
This class must include the do_tracking method, which defines the logic for interacting with the external application through the API or SDK.
The do_tracking method returns a list of key-value metrics and outcomes, including details like detected drift or model performance metrics. This abstraction ensures compatibility with any monitoring application.
After defining the Python class, register it as a monitoring function in MLRun. Use the set_model_monitoring_function method to add the function to your MLRun project and deploy it.
Once deployed, the monitoring application integrates seamlessly into the MLRun workflow.
You can see an example of how this works with open-source Evidently right here.
MLRun offers several key advantages for integrating external monitoring applications:
Model monitoring is foundational for maintaining reliable gen AI applications. MLRun simplifies the process by offering a generic, modular approach to integrating external monitoring applications. Whether your organization uses a market-leading tool or a custom-built solution, MLRun can fit seamlessly into your monitoring strategy.
