New Blog: Bringing (Gen) AI from Laptop to Production with MLRun

Launching MLRun 1.7: Gen AI and LLM Monitoring

V1.7 brings significant LLM monitoring enhancements, helping users ensure the integrity and operational stability of LLMs in production environments.

As the open-source maintainers of MLRun, we’re proud to announce the release of MLRun v1.7.  MLRun is an open-source AI orchestration tool that accelerates the deployment of gen AI applications, with features such as LLM monitoring, data management, guardrails and more. We provide ready-made scenarios that can be easily implemented by teams in organizations. This new release is packed with powerful features designed to make gen AI deployments more flexible and faster than ever before.

Specifically, V1.7 brings significant LLM monitoring enhancements, helping users ensure the integrity and operational stability of LLMs in production environments. Additional updates introduce performance optimizations, multi-project management, and more.

Read all the details below:

1. Flexible Monitoring Infrastructure

MLRun 1.7 introduces a new, flexible monitoring infrastructure that enables seamless integration of external tools and applications into AI pipelines, using APIs and pre-built integration points. This includes tools for external logging, alerting, metrics systems, etc. 

For instance, users can now:

  • Track custom metrics that are specifically tailored to business needs, such as user-defined success metrics or domain-specific KPIs.
  • Integrate with open-source tools like Evidently, which enables advanced tracking of model performance metrics (e.g., distribution shifts, data quality, and accuracy).
  • Leverage external logging services to centralize logs and improve the visibility of pipeline activities

2. Better Monitoring of Unstructured Data

Given that LLMs primarily handle unstructured data, one of the key advances in MLRun 1.7 is its enhanced ability to enable tracking this kind of data with more precision.

A common way to monitor LLMs is to create another model that would act as a judge. See a demo of how this works.

3. Endpoint Metrics UI and Customization

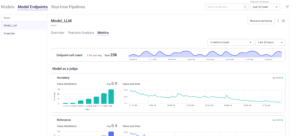
MLRun 1.7 introduces a new endpoint metrics UI. Its expanded endpoint monitoring capabilities allow users to:

  • Select and investigate different endpoint metrics, such as accuracy and response times.
  • View various metrics related to model endpoints, such as the number of activations or event counts.
  • Visualize trends through time series and histogram views
  • Customize the monitoring time frame, such as looking at data from the past week or another specified period.

For example, a time-series chart could indicate a bottleneck in the inference pipeline or model scaling issues.

The ability to track, visualize, and analyze endpoint performance enables teams to adjust operational parameters or retrain models as soon as performance starts to degrade. This reduces downtime or adverse effects in production environments.

With these capabilities, users can now customize their monitoring stacks per their business and tech stack requirements. Future releases will continue to enhance these capabilities, with more features and integrations for monitoring. This will allow for even greater flexibility and user control. So please share your feedback, so we can extend them based on your needs.

Spotlight: Gen AI Banking Chatbot Demo

See a gen AI banking chatbot that uses MLRun’s new monitoring capabilities for fine-tuning, ensuring it only answers banking-related questions. This helps address the risks associated with gen AI, like hallucinations, inaccuracies, bias, harmful content, and more.

Watch the demo here.

5. Simplified Docker Deployment Workflow

Version 1.7 simplifies the process of deploying Docker images, making it easier for users to run applications and models. Previously, deploying applications or models via Docker required manual configuration, with open-source Nuclio, and integration steps. Now, users can simply provide a Docker image and deploy it with minimal setup.

This improvement opens up development workflow possibilities. For example, users can more easily integrate custom UIs or dashboards that can interact with deployed models, allowing for more advanced and customized monitoring capabilities.

6. Cross-Project View

For enterprises working on multiple projects across diverse teams, keeping track of workflows and active jobs can become overwhelming. MLRun 1.7 introduces a cross-project view that consolidates all activities across projects into a single, centralized dashboard.

The cross-project view provides real-time visibility into all active jobs, workflows, and ML models across different projects. Users can:

  • Monitor multiple projects to see which workflows and jobs are running, completed, or failed.
  • Identify issues in specific projects quick and more effectively

This is especially valuable for organizations with complex environments where multiple teams may be working on different but interrelated projects.

7. Community-Driven Innovations and Performance Enhancements

Finally, MLRun 1.7 introduces improvements based on the invaluable feedback from you, our community users. We listened to the requirements and are releasing features that provide value in areas the community cares about most. This version introduces improved UI responsiveness, more efficient handling of large datasets, and a host of usability fixes. We look forward to your continued feedback on this version and the upcoming ones as well.

Join the Conversation

We’re looking forward to hearing your feedback about MLRun 1.7 and your future needs for the upcoming versions. Join the community and share your insights and requirements.

Read the full changelog.

Explore MLRun 1.7.

Recent Blog Posts
MLRun v1.8 Release: with Smarter Model Monitoring, Alerts and Tracking
MLRun v1.8 adds features to make LLM and ML evaluation and monitoring more accessible, practical and...
Gilad Shaham
November 1, 2024
Introducing MLRun v1.10: Build better agents, monitor everything
We’re proud to announce a series of advancements in mlrun v1.10 designed to power your end-to-end or...
Michal Eshchar
November 1, 2024
Introducing MLRun Community Edition
MLRun CE is the out-of-the-box solution of MLRun for AI and ML orchestration and model lifecycle man...
Gilad Shapira
November 1, 2024

How to Operationalize Your Own Customized Application for Monitoring LLMs with MLRun

Operationalize Your Own Customized Application for Monitoring LLMs

LLM monitoring helps optimize for accuracy and efficiency, detect bias and ensure security and privacy. But common metrics like BLEU and ROUGE aren’t always accurate enough for LLM monitoring. By developing your own monitoring application, you can customize and tailor the metrics you need, monitor in real-time, integrate with other systems, and more. In this blog post, we explain how to do this with MLRun.

Why Monitor LLMs and Gen AI Applications?

Monitoring generative AI applications and LLMs is an essential step in the AI pipeline. By monitoring, data professionals ensure models are accurate and bring business value. It also helps remove the risks associated with gen AI.

Overall, LLM monitoring can help:

  • Manage resources and reduce operational costs.
  • Optimize for efficiency and accuracy, ensuring model reliability at a given task and checking if it needs to go into another phase of development.
  • Detect errors, biases, or inaccuracies in outputs, ensuring they meet quality standards.
  • Identify and mitigate ethical issues like bias and toxicity, before they become public concerns.
  • Ensure data privacy and security, to prevent data leakage, violation of privacy regulations, and more
  • Meet compliance regulations.
  • Understand how users interact with the model.
  • Build trust among stakeholders.

Key LLM Metrics to Track

There are many trackable LLM metrics, which can help meet the objectives detailed above. These include first-level metrics, model-related metrics, data metrics and more.

If the pipeline is: X -> Model -> Y

  • Data metrics check X.
  • Accuracy metrics check Y and sometimes Y | X (Y given X).
  • Performance check the arrows.

Given this, the common metrics include:

  • Performance Optimization – Latency, throughout, resource utilization (CPU/GPU memory usage), data drift, sensibleness and specificity.
  • LLM Evaluation (Accuracy) – Perplexity, BLEU (Bilingual Evaluation Understudy), ROUGE (Recall-Oriented Understudy for Gisting Evaluation), METEOR (Metric for Evaluation of Translation with Explicit Ordering), F1 score and accuracy.
  • Data Metrics – Data drift

Additional metrics that can be monitored include:

  • User Engagement – Session length, token efficiency
  • Ethical Compliance – Adherence to guidelines, like privacy, non-discrimination, transparency and fairness.

In addition to these, data engineers and scientists can also come up with their own metrics, based on use cases and requirements. This is valuable for monitoring LLMs, since these popular metrics don’t always cover unique LLM monitoring needs.

For example:

  • Logic monitoring metrics, which evaluate the logical processes and decision-making pathways of a system. They include input classification, response consistency, error detection, decision pathway analysis, and performance measurements.
  • Domain-specific metrics or evaluation methods, including industry-specific terminologies, contextual relevance, or specialized linguistic nuances.
  • Bias detection algorithms that operate based on your organization’s ethical standards and regulatory requirements.

Benefits of Operationalizing Your Own Monitoring Application

By developing your own monitoring application, you can monitor LLMs based on the metrics you need, to ensure your LLM is fully-optimized to your use case. This will ensure it brings business value and help avoid LLM risks that have technological and business implications.

By developing and deploying your own monitoring application you can:

  • Tailor evaluation criteria to align closely with your specific use case or domain, maximizing business value.
  • Incorporate real-time monitoring, alerting you about anomalies or performance issues as they occur.
  • Integrate your monitoring application seamlessly with other internal systems or workflows
  • Future-proof to adapt as new models and technologies emerge, keeping your application relevant and up-to-date.
  • Generate customized reports tailored to your organization’s specific needs, providing actionable insights and data-driven decision-making.

How to Easily Develop a Monitoring Application for Your LLM with MLRun

Open-source MLRun provides a radically simplified solution, allowing anyone to develop and deploy their own monitoring application in a few simple lines of code. Inherit the `MonitoringApplication` class, implement one method and that’s it!

You can see the full tutorial with code snippets and examples in the MLRun documentation.

Get started with MLRun now.

Recent Blog Posts
MLRun v1.8 Release: with Smarter Model Monitoring, Alerts and Tracking
MLRun v1.8 adds features to make LLM and ML evaluation and monitoring more accessible, practical and...
Gilad Shaham
July 24, 2024
Introducing MLRun v1.10: Build better agents, monitor everything
We’re proud to announce a series of advancements in mlrun v1.10 designed to power your end-to-end or...
Michal Eshchar
July 24, 2024
Introducing MLRun Community Edition
MLRun CE is the out-of-the-box solution of MLRun for AI and ML orchestration and model lifecycle man...
Gilad Shapira
July 24, 2024

Deploying Hugging Face LLM Models with MLRun

Deploying Hugging Face LLM Models with MLRun

Hugging Face has become a leading model repository, offering user-friendly tools for building, training and deploying ML models and LLMs models. In combination with MLRun, an open-source platform that automates data prep, tuning, validating and optimizing ML models and LLMs over elastic resources, Hugging Face empowers data scientists and engineers to bring their models to production more quickly and efficiently.

This blog post introduces Hugging Face and MLRun, demonstrating the benefits of using them together. It is based on the webinar “How to Easily Deploy Your Hugging Face Models to Production”, which includes a live demo of deploying a Hugging Face model with MLRun. The demo covers data preparation, a real application pipeline, post-processing and model retraining.

You can also watch the webinar, featuring Julien Simon, Chief Evangelist at Hugging Face, Noah Gift, MLOps expert and author, and Yaron Haviv, co-founder and CTO of Iguazio (acquired by McKinsey).

Hugging Face and LLMs

Hugging Face has gained recognition for its open-source library, Transformers, which provides easy access to pre-trained models. These include LLMs like BERT, GPT-2, GPT-3, T5 and others. These models can be used for various MLP tasks such as text generation, classification, translation, summarization and more.

By providing a repository of pre-trained models that users can fine-tune for specific applications, Hugging Face significantly reduces the time and resources required to develop powerful NLP systems. This enables a broader range of organizations to leverage advanced language technologies, thus democratizing access to LLMs.

The impact of Hugging Face’s LLMs spans various industries, including healthcare, finance, education and entertainment. For instance, in healthcare, LLMs can assist in analyzing medical records, extracting relevant information and supporting clinical decision-making. In finance, these models can enhance customer service through chatbots and automate the analysis of financial documents.

Now let’s see how Hugging Face LLMs can be operationalized.

Deploying Your Hugging Face LLM Model with MLRun

MLRun is an open-source MLOps orchestration framework that enables managing continuous ML and gen AI applications across their lifecycle, quickly and at scale. Capabilities include:

  • Automating data preparation, tuning, validation and model optimization
  • Deploying scalable real-time serving and application pipelines that include models, data and business logic
  • Built-in observability and monitoring for data, models and resources
  • Automated retraining and re-tuning
  • Flexible deployment options (multi-cloud, hybrid and on-prem)

Using MLRun with Hugging Face

Deploying Hugging Face models to production is streamlined with MLRun. Below, we’ll outline the steps to build a serving pipeline with your model and then retrain or calibrate it with a training flow that processes data, optimizes the model and redeploys it.

Workflow #1: Building a Serving Pipeline

  1. Start by setting up a new project in MLRun.
  2. Add a Serving Function – Define a serving function with the necessary steps. A basic serving function may include intercepting a message, pre-processing, performing sentiment analysis with the Hugging Face model and post-processing. You can expand this with additional steps and branching as needed.

Hugging Face models are integrated into MLRun, so you only need to specify the models you want to use.

  1. Simulate Locally – MLRun provides a simulator for your serving function, allowing you to test it locally.
  2. Test the Model – Push requests into the pipeline to verify its functionality. Debug as necessary.
  3. Deploy the model as a real-world endpoint. This involves running a simple command, with MLRun handling the backend processes like building containers, pushing to repositories, and serving the pipeline. This results in an elastic, auto-scaling service.

Workflow #2: Building a Training Pipeline

  1. Begin by creating a new project in MLRun.
  2. Register Training Functions – Define the training functions, including the training methods, evaluation criteria and any other necessary information.
  3. Set the Workflow – Outline the training steps, such as preparing datasets, training based on the prepared data, optimizing the model, and deploying the function. Models can be deployed to various environments (production, development, staging) simultaneously. These workflows can be triggered automatically with CI systems.
  4. Run the Pipeline – Execute the training pipeline, which can be monitored through MLRun’s UI. Since MLRun supports Hugging Face, training artifacts are saved for comparisons, experiment tracking, and more.
  5. Test the Pipeline – Verify that the model’s predictions have changed following the training.
  6. Deploy the newly trained model.

Integrating Hugging Face with MLRuns significantly shortens the model development, training, testing, deployment,and monitoring processes. This helps operationalize gen AI, effectively and efficiently.

FAQs

What is the significance of deploying LLM applications?

Tt transforms models from research prototypes into real-world tools that deliver value. Deployment enables organizations to embed AI capabilities like chatbots, copilots, analytics assistants, and domain-specific knowledge engines into workflows, making advanced reasoning and natural language understanding accessible at scale. It also ensures that models can be integrated with enterprise systems, comply with governance requirements, and provide measurable ROI. Without deployment, LLMs remain experiments rather than operational assets.

Can I fine-tune a Hugging Face model before deployment?

Hugging Face models can be fine-tuned before deployment to better suit specific domains, tasks, or data. Hugging Face provides libraries such as PEFT (Parameter-Efficient Fine-Tuning) that make fine-tuning more accessible and cost-effective. Fine-tuning should be followed by evaluation and testing to ensure the model generalizes well. 

What are common challenges faced when retraining LLM models?

  1. A) Large models require significant GPU or TPU resources, making frequent retraining expensive. B) If the new training data is noisy, biased, or incomplete, it can degrade performance. C) Catastrophic forgetting, where retraining on new data causes the model to lose accuracy on previously learned knowledge. D) Compliance, especially if retraining data includes sensitive or personally identifiable information. E) LLM retraining adds operational complexity: managing model versions, tracking experiment metadata, and ensuring reproducibility require strong MLOps practices.

How do I monitor the performance of my deployed LLM applications?

Measure latency, throughput, error rates, accuracy, groundedness, hallucination rates, and relevance. Tools like MLRun can be used either natively or by integrating with your monitoring tool of choice.

Are Hugging Face models production-ready?

Many models on Hugging Face’s Model Hub are community-contributed and vary in quality, documentation, and licensing, so directly deploying Hugging Face without adaptation can introduce risks. For enterprise use, organizations often need to fine-tune, harden, and validate models before declaring them production-ready.

How does MLRun support flexible deployment options for AI models?

MLRun is an open-source MLOps orchestration framework that enables flexible deployment of AI models across environments. It supports running models on Kubernetes, serverless functions, batch jobs, or real-time pipelines, in the cloud or on-premises, making it easier to adapt deployment to specific workloads. This flexibility ensures that organizations can choose the most cost-efficient and scalable option for each use case.

Learn more about MLRun and Hugging Face for your gen AI workflows.

Recent Blog Posts
MLRun v1.8 Release: with Smarter Model Monitoring, Alerts and Tracking
MLRun v1.8 adds features to make LLM and ML evaluation and monitoring more accessible, practical and...
Gilad Shaham
June 16, 2024
Introducing MLRun v1.10: Build better agents, monitor everything
We’re proud to announce a series of advancements in mlrun v1.10 designed to power your end-to-end or...
Michal Eshchar
June 16, 2024
Introducing MLRun Community Edition
MLRun CE is the out-of-the-box solution of MLRun for AI and ML orchestration and model lifecycle man...
Gilad Shapira
June 16, 2024

Tutorial: Build a Smart Call Center Analysis Gen AI App with MLRun, Gradio and SQLAlchemy

Tutorial: Build a Smart Call Center Analysis Gen AI App with MLRun, Gradio and SQLAlchemy

Developing a gen AI app requires multiple engineering resources, but with MLRun the process can be simplified and automated. In this blog post, we show a tutorial of building an application for a smart call center application. This includes a pipeline for generating data for calls and another pipeline for call analysis. For those of you interested in the business aspect, we added information in the beginning about how AI is impacting industries.

You can follow the tutorial along with the respective Notebook and clone the Git. Don’t forget to star us on Github when you do! You can also watch the tutorial video.

How AI is Impacting the Economy

AI is changing our economy and ways of work. According to McKinsey, AI’s most substantial impact is in three main areas:

  • Productivity – Improving how businesses are run, from customer interactions to coding to content creation.
  • Product Transformation – Changing how products meet customer needs. This includes conversational interfaces and co-pilots, as well as hyper-personalization, i.e customer-specific content at a granular level.

Redistributing profit pools – AIaaS (AI-as-a-Service) is added to the value chain, resulting in new solutions and entire value chains being replaced.

AI Pitfalls to Avoid

When building a gen AI app and operationalizing LLMs, it’s important to perform the following actions:

  1. Define a value roadmapWithout a clear value roadmap, projects can easily drift from their intended goals. This roadmap aligns the AI initiative with business objectives, ensuring that the development efforts lead to tangible benefits.
  2. Avoid technological and operational debtAvoiding this debt ensures the long-term sustainability and maintainability of the AI system.
  3. Take into consideration the human experienceIgnoring the human experience can lead to an AI solution that users find difficult or unpleasant to use, impeding adoption and productivity.
  4. Use a scalable and resilient gen AI architecture to ensure you reach production – Otherwise, the architecture might fail under increased loads or during unexpected disruptions.
  5. Implement processes to ensure AI maturity and governanceWithout proper processes, the AI system can become unreliable, biased, or non-compliant with regulations. Governance ensures that the AI operates within acceptable ethical and legal boundaries.
  6. Define quantifiable KPIsClear KPIs create accountability and focus, ensuring that the project stays on track.

Now let’s dive into the hands-on tutorial.

Tutorial: Building a Gen AI Application for Call Center Analysis

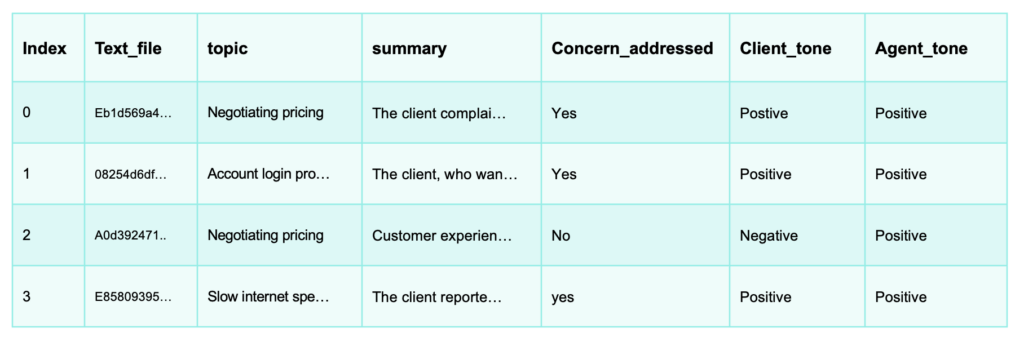
The following tutorial shows how to build an LLM call center analysis application. We’ll show how you can use gen AI to analyze customer and agent calls so your audio files can be used to extract insights.

This will be done with MLRun in a single workflow. MLRun will:

  • Automate the workflows
  • Auto-scale resources
  • Automatically distribute inference jobs to workers
  • Automatically log and parse the values of the workflow steps

As a reminder, you can:

Installation

  1. First, you will need to install MLRun, Gradio and SQLAlchemy and add tokens. The project is created in the Notebook.

Data Generation Pipeline

  1. Now it’s time to generate call data. You can skip this if you already have your own audio files for analysis. We also have saved generated data in the Git repo you can use, enabling you to run the demo without an OpenAI key.

This comprises six steps, some of which are based on MLRun’s Function Hub:

The resulting workflow will look like this:

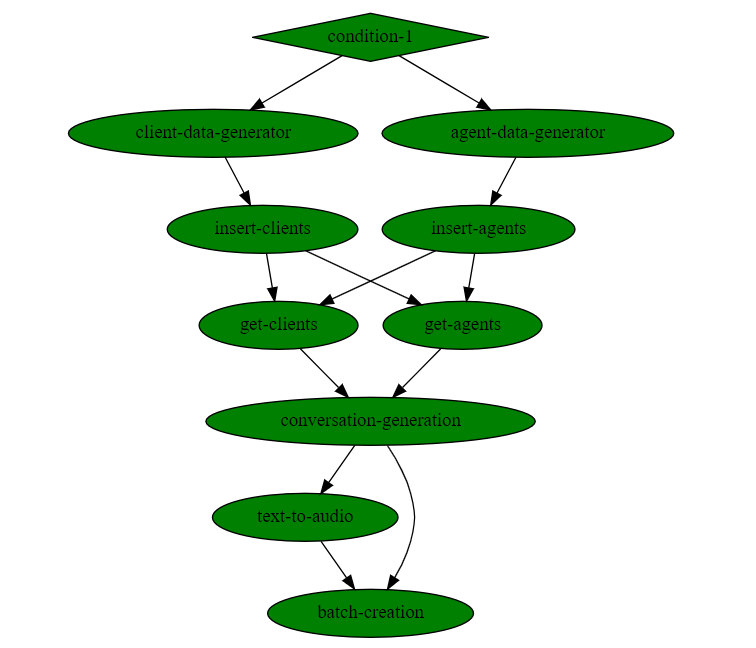
As you can see, no code is required. More details on each step and when to use them, in the documentation.

  1. Run the workflow by calling the project’s method project.run. You can also configure the workflow with arguments.

Data Analysis Pipeline

  1. Now it’s time for the data analysis pipeline. The steps in this pipeline are:
  • Inserting calls
  • Diarization
  • Transcription
  • PII recognition
  • Analysis
  • Post-processing

And it looks like this:


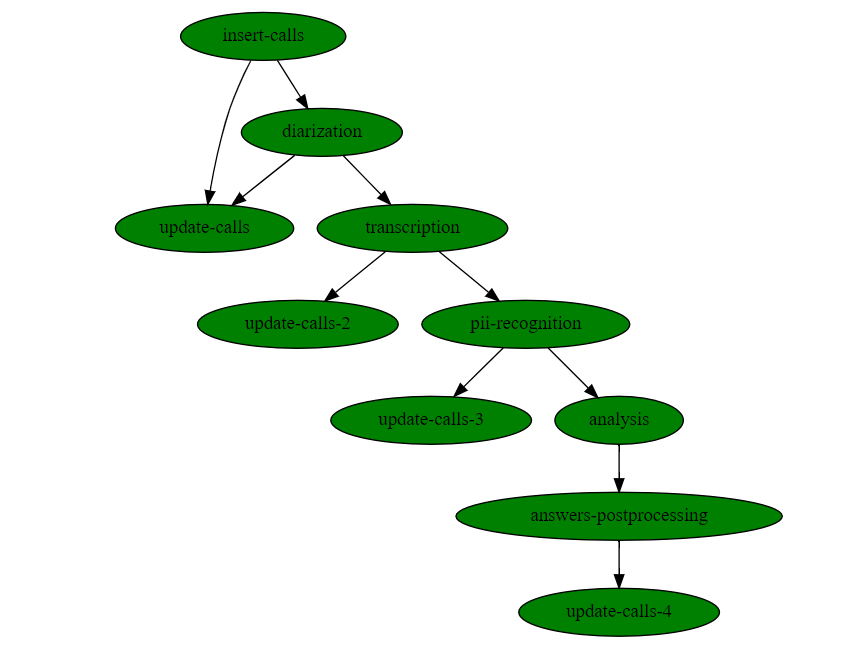
Similarly, no coding is required here either.

  1. Run the workflow and view the results.

Here’s how some of the steps are executed:

  • Analysis – Generating a table with the call summary, its main topic, customer tone, upselling attempts and more:

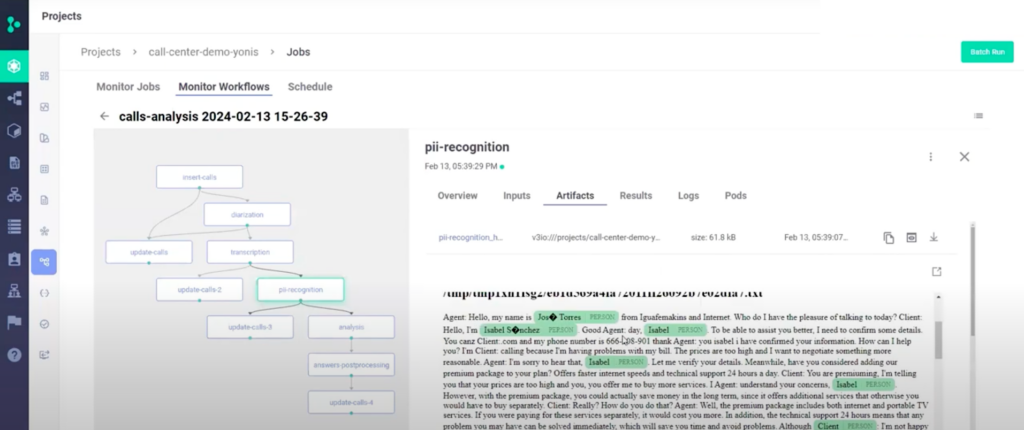
6. You can also use your database and the calls for developing new applications, like prompting your LLM to find a specific call in your call database in a RAG based chat app.To hear what a real call sounds like, watch the video of this tutorial.

Advanced MLRun Capabilities

In addition to simplifying the building and running of the pipelines, MLRun also allows auto logging, auto distribution and auto scaling resources.

Try MLRun for yourself.

Recent Blog Posts
MLRun v1.8 Release: with Smarter Model Monitoring, Alerts and Tracking
MLRun v1.8 adds features to make LLM and ML evaluation and monitoring more accessible, practical and...
Gilad Shaham
June 13, 2024
Introducing MLRun v1.10: Build better agents, monitor everything
We’re proud to announce a series of advancements in mlrun v1.10 designed to power your end-to-end or...
Michal Eshchar
June 13, 2024
Introducing MLRun Community Edition
MLRun CE is the out-of-the-box solution of MLRun for AI and ML orchestration and model lifecycle man...
Gilad Shapira
June 13, 2024