MLRun v1.8 Release: with Smarter Model Monitoring, Alerts and Tracking
MLRun v1.8 adds features to make LLM and ML evaluation and monitoring more accessible, practical and resource-efficient.


Today we’re announcing MLRun 1.8, now available to the community. This latest version adds to the series of improvements to LLM monitoring released in 1.7, with in-platform alerts. Plus, several more improvements to help to track and evaluate models, and navigate the platform with ease.
Read all the details below:
MLRun v1.7 introduced a flexible monitoring infrastructure, the ability to monitor unstructured data, metrics customization, and more.
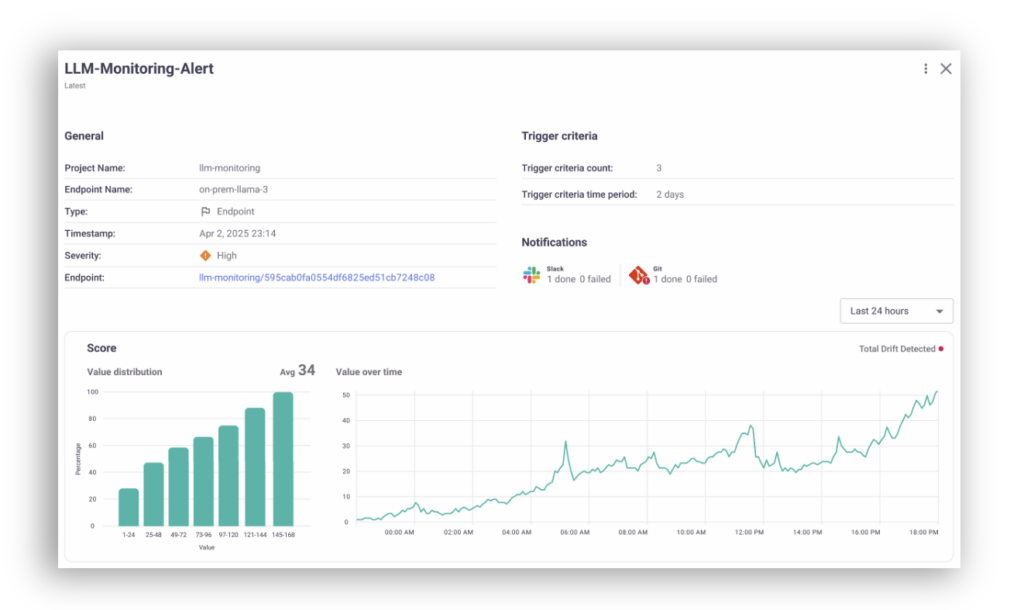
MLRun v1.8 builds on these capabilities and now includes monitoring alerts built into the MLRun UI.
Users can set up alerts on criteria such as:
Once alerted, users can click through to the flagged issues and investigate directly in MLRun, without having to context switch to external monitoring systems.
Experiment tracking is used to measure metrics, compare results, reproduce experiments and optimize models. This is a core MLRun capability.
Now, MLRun v1.8 supports experiment tracking for document-based models, like LLMs. This is enabled through the LangChain API, which is integrated into vector databases.
Users can track their documents as artifacts, with metadata like:
Debugging LLMs is a complicated process. It requires: 1) Deployment 2) Realizing there’s an issue 3) Identifying the root cause 4) Analysis and evaluation 5) Fixing 6) Redeploying. This process is long, technologically complex and resource-intensive. It’s also prone to potential errors.
In MLRun v.1.8, this process is shorter and more resource-efficient. Users can now monitor and evaluate models before deploying them. MLRun runs the model, returning performance results without consuming unnecessary compute resources.
Managing large-scale projects across teams requires a reliable and user-friendly system.
Following user requests, MLRun v1.8 includes pagination, to enhance responsiveness and reduce scrolling and performance bottlenecks arising from long page loading times.
What’s your feedback on MLRun 1.8? Join the community and share your insights and requirements for future releases.
Explore MLRun 1.8.
